Twice a year, the argument about who is responsible for Britain’s pollution plays out in the abstract: industry blames households, households blame industry, and everyone blames somebody else’s country. What rarely enters the argument is that the answer, for the industrial half of the question, is published. It sits in a file called the UK Pollutant Release and Transfer Register: 5,802 facility reports for the 2024 reporting year, each one naming the site, the operator, the substance and the tonnage, from the largest power station in the country down to individual pig units. The file is public. It is also close to unreadable, which is why almost nobody reads it. We did. This analysis processes every row of the 2024 register - every reported release to air and water, across England, Wales, Scotland and the offshore installations regulated through the energy department - and pairs it with Defra’s consumption-based carbon footprint statistics published in June. Together they answer two questions that are usually muddled into one: who actually emits, and who is actually responsible. The answers are more specific, and considerably stranger, than the public argument suggests. How the register works, in one minuteThe Pollutant Release and Transfer Register exists because the UK signed the international Kyiv Protocol on pollution transparency: any large industrial facility above set activity and release thresholds must report its annual releases, by named substance, to a public register. The Environment Agency compiles England’s returns, Natural Resources Wales and the Scottish regulator theirs, and the energy department collects the offshore platforms. The numbers are operator-reported under permit conditions - measured, calculated or estimated, with the basis recorded against each entry - and audited by the regulators. Two boundaries matter for everything that follows. First, the register captures large facilities only: the 106.6 million tonnes of CO2 reported here is roughly a quarter of the UK’s territorial emissions, because cars, homes, offices, most farms and small businesses sit below its thresholds. Second, a place on this list is not an accusation: these are lawful, permitted releases. The register exists precisely so that the public can see them - and the fact that almost nobody does is a failure of translation, not of transparency. The CO2 league table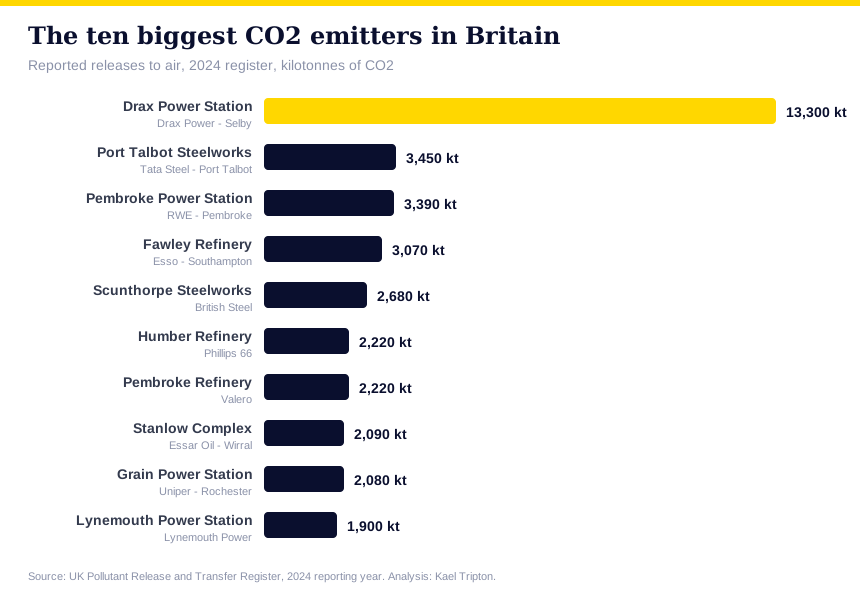 The top of the table is not close. Drax power station near Selby reported 13.3 million tonnes of CO2 - more than the second, third and fourth largest sites combined. Behind it comes a portrait of what remains of heavy industry in Britain: the Port Talbot steelworks (3.45 million tonnes in its final blast-furnace era), RWE’s gas-fired Pembroke power station across the water from it, Esso’s Fawley refinery outside Southampton, and British Steel’s Scunthorpe works. Three of the top seven sites sit in one small corner of south-west Wales. 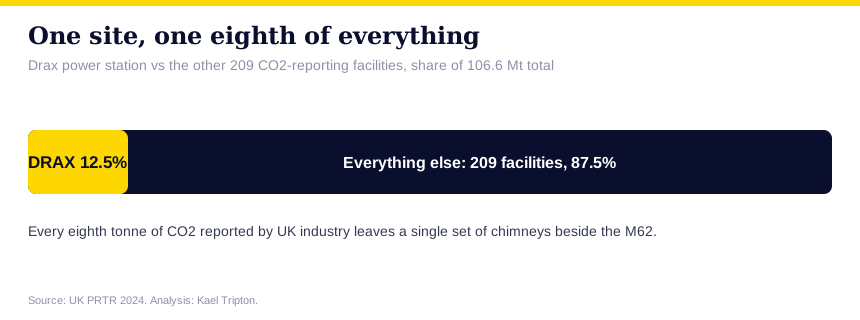 Concentration is the register’s defining feature. Just 210 of the 5,802 reporting facilities release enough CO2 to appear in the carbon table at all, and within them the top ten account for 34% of everything reported. By parent company, Drax Power leads on 13.3 million tonnes, followed by RWE with 7.15 million tonnes across its gas fleet, Uniper on 5.07 million tonnes, Tata Steel on 3.45 and Esso on 3.07. If the ten biggest sites were a country, they would out-emit Ireland’s entire territorial total. The Drax asterisk: Britain’s biggest emitter is officially cleanDrax deserves its own section because it embodies the strangest fact in UK climate accounting. The station burns wood pellets, mostly imported from North American forestry, having converted from coal across the last decade. Combustion is combustion: the carbon leaves the chimneys at Selby, and the register faithfully records it - 13.3 million tonnes, the largest single stack of CO2 in the country, plus 7,190 tonnes of nitrogen oxides, the largest NOx release too. But under international carbon accounting rules, biomass emissions are booked to the land-use ledger of the country where the trees grew, on the logic that regrowing forests reabsorb the carbon. The result is that the largest CO2 source in Britain is counted as close to zero in the UK’s official generation emissions, and the operator receives renewable subsidies - funded through electricity bills - for the same combustion the register records. Both statements are true simultaneously; they simply belong to different ledgers. The register measures what leaves the chimney. The carbon accounts measure who is deemed responsible for it. Whether the second ledger’s logic holds - whether harvested forests really reabsorb the carbon on a timescale that matters - is one of the liveliest disputes in climate policy, and the register is the reason the public can even see the tonnage being disputed. What the sectors show: electricity still dominates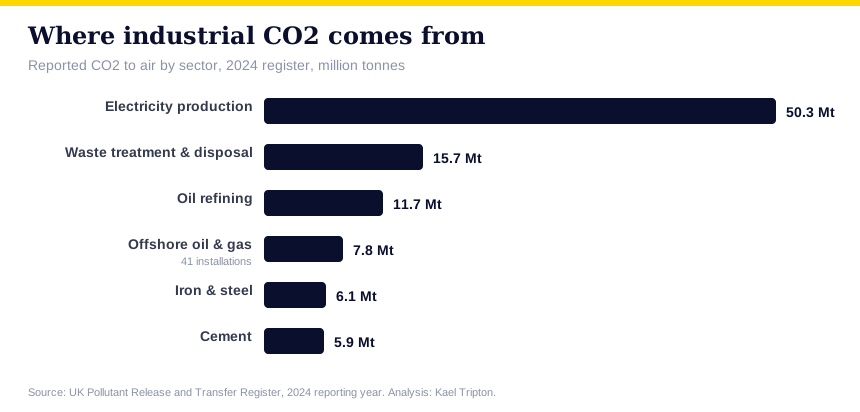 Half of all reported CO2 - 50.3 million tonnes - comes from electricity production, despite three decades of grid decarbonisation, because the register captures precisely the plants that still run: Drax’s biomass units and the gas fleet that fills the gaps around wind and solar. Pembroke, Grain, Staythorpe, Keadby, Marchwood, Saltend: the gas stations that set the power price in Britain’s marginal-pricing electricity market are the same names filling this table, which is why the carbon column and your electricity bill are more closely related than they appear. When gas plants run less, both fall together - Connah’s Quay in North Wales attributed its emissions drop for the year to exactly that in its own remarks to the register. The surprise in second place is waste: 15.7 million tonnes of CO2 from treatment and disposal, driven by the energy-from-waste incinerators that replaced landfill as the destination for household rubbish. That tonnage belongs, in a very direct sense, to household bins. Refining follows on 11.7 million tonnes across sites like Fawley, Humber, Pembroke and Stanlow - the four-site backbone of Britain’s petrol and diesel supply - then the offshore oil and gas fleet, then steel and cement, the two industries for which no commercial-scale low-carbon substitute yet operates in the UK. Offshore: 41 platforms, 7.2 million tonnesThe register’s least-visible chapter floats in the North Sea. Forty-one offshore installations - platforms and floating production vessels with names like Buzzard, Elgin, Glen Lyon and Armada Kraken - reported 7.2 million tonnes of CO2 between them, largely from gas turbines that run around the clock to power drilling, pumping and processing far from any grid connection. Two floating production vessels appear among the ten biggest NOx sources in the entire country, ahead of most onshore refineries. As the North Sea basin declines, this line of the register will fall with it - but for now, extracting Britain’s remaining oil and gas emits more CO2 than the whole cement industry. Methane: the coal mine that beats every landfill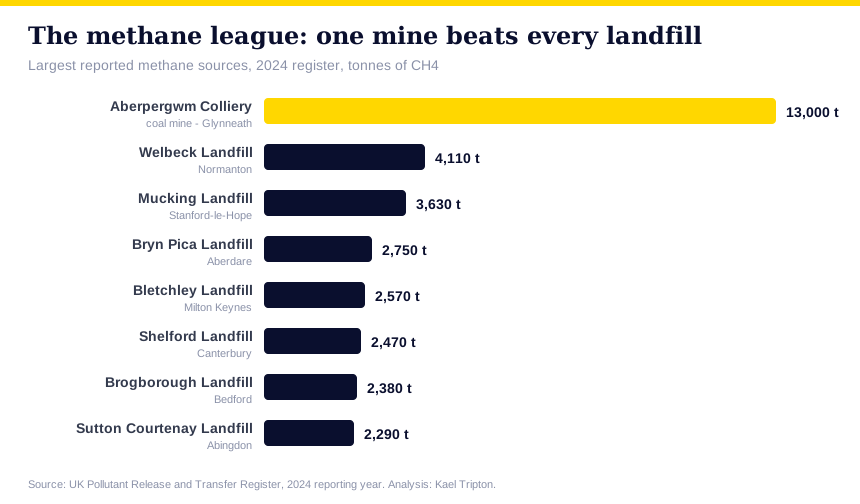 Carbon dioxide is the biggest number on the register but not the sharpest story. That belongs to methane - a gas that traps roughly 28 times more heat than CO2 over a century - where 18 of the top 20 sources are exactly what you would expect: landfill sites, quietly exhaling as decades of buried rubbish decompose, from Welbeck in Yorkshire to Mucking on the Thames estuary. The largest source, though, is not a landfill. It is Aberpergwm Colliery near Glynneath, one of the last working coal mines in Britain, which reported 13,000 tonnes of methane in a single year - more than three times the biggest landfill. Weighted for its warming power, that one mine’s methane equals roughly 360,000 tonnes of CO2, a larger climate impact than many of the gas power stations on this register, from a site most people in Britain have never heard of. Coal-seam methane venting is among the cheapest emissions in the country to abate, which makes this single gold bar on the chart arguably the most cost-effective climate target in the entire dataset. The air quality table: NOx, SOx and dustBeyond greenhouse gases, the register tracks the pollutants that shape air quality. Nitrogen oxides are led, again, by Drax on 7,190 tonnes, followed by the refining complexes at Stanlow (3,080 tonnes) and Fawley (2,820 tonnes), with the offshore vessels close behind and Hope cement works in the Peak District the highest inland site outside power and refining. Sulphur oxides tell a purely industrial story: Stanlow on 5,660 tonnes, Grangemouth on 5,080, Fawley on 4,260 - the last redoubts of a pollutant that acid-rain regulation largely defeated a generation ago. Carbon monoxide and coarse particulates (PM10) belong overwhelmingly to steel: Port Talbot reported 41,500 tonnes of CO and Scunthorpe 34,000 tonnes, with the same two works topping the dust table at around 1,100 tonnes of PM10 each. As both sites transition from blast furnaces to electric arc steelmaking, these columns of the register should collapse within a few reporting years - making the 2024 file a historical document of the end of conventional British steelmaking, whatever one thinks of how that end was managed. Water: the sewage numbers, by company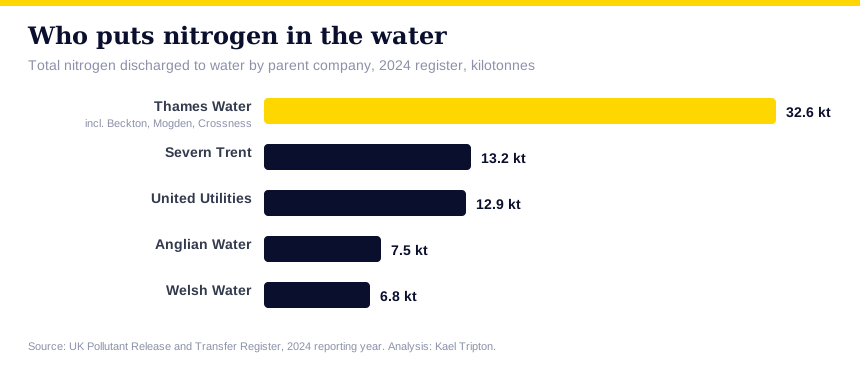 The register’s water pages read differently from its air pages: 3,399 of the 5,385 release records are discharges to water, and the dominant substance is nitrogen - 122,000 tonnes of it, the nutrient that drives the algal blooms and river-health failures behind the sewage controversy. Rank the dischargers by parent company and the league table writes itself: Thames Water first on 32,600 tonnes, from giant treatment works like Beckton (9,650 tonnes alone), Mogden and Crossness; Severn Trent second on 13,200; United Utilities on 12,900; Anglian on 7,500; Welsh Water on 6,800. Context cuts both ways here. Sewage treatment exists to remove nitrogen, and a large works serving millions of Londoners will lawfully discharge more than a small one - Beckton is Europe’s largest treatment works, so its position is partly arithmetic. But the same register that names the companies also prices the problem: nitrogen removal is the capital programme sitting inside the bill increases every water customer is now paying, and the tonnages above are the baseline against which those investments will succeed or fail. One oddity worth savouring: fourth place on the site-level nitrogen table is not a sewage works at all but the Girvan grain distillery in Ayrshire - 3,930 tonnes - a reminder that whisky is, among other things, a nitrogen business. The farms, the factories and the accidentsThe register’s long tail is where its texture lives. The most common facility type is not a power station but a waste site - 3,044 of the 5,802 reports - followed by hazardous waste treatment, poultry farms (252 units, reporting ammonia), marine fish farms and pig units. Ammonia, mostly agricultural, is the most frequently reported substance of all. The largest accidental releases of the year were two pig units’ ammonia escapes and a sulphur-oxide release at Hope cement works - 39 accidental entries in total, a genuinely small number against 5,385 release records, and a quiet argument that the permitting system mostly works. A nitrous oxide footnote deserves rescuing from obscurity: the biggest N2O source in the country is the Clitheroe catalyst factory in Lancashire at 232 tonnes - and since N2O traps roughly 265 times more heat than CO2, that small line equals about 60,000 tonnes of CO2 from a single specialised plant, ahead of Drax’s own N2O and the Billingham fertiliser works that historically defined the category. Two ledgers, one honest picture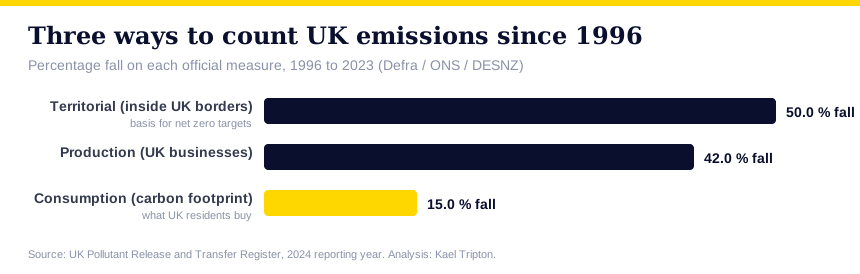 Set the register alongside Defra’s carbon footprint statistics, published a month before it, and the full shape of Britain’s emissions becomes visible. The register counts what industrial chimneys inside the UK release: on that territorial basis, national emissions have halved since 1996, and the register is the itemised receipt - coal plants gone, steel shrinking, refineries consolidating. The footprint counts what UK residents consume, wherever it was made: on that basis the fall is just 15%, because 53% of the footprint now happens abroad, in the factories - increasingly Chinese - that make what Britain no longer does. One tonne in every eight of the UK’s consumption footprint is emitted in China; one tonne in every eight of the CO2 reported at home is emitted at Drax. The two eighths are unrelated arithmetic, and together they are the entire story: Britain partly cut its emissions and partly exported them, and both halves are now precisely measured. The map: where Britain’s reported pollution livesSplit the register by nation and regulator, and reported CO2 concentrates hard: facilities regulated in England account for 76.8 million tonnes, Wales for 12.4 million - a striking figure for a nation of three million people, produced almost entirely by the industrial crescent from Port Talbot through the two Pembroke sites, and a legacy of hosting the heavy plant the rest of Britain retired. Scotland’s onshore total is comparatively modest, though Grangemouth alone carries the country’s second-largest sulphur release, and the offshore fleet - administratively Scottish in geography if not in regulation - adds its 7.2 million tonnes from the North Sea. Locally, the pattern is even sharper: the Humber estuary hosts four top-twenty CO2 sites within a few miles of each other (Scunthorpe, the Humber refinery, Immingham CHP and Keadby), making it, on this register, the most emissions-dense stretch of coastline in Britain - and, not coincidentally, the place where most of the UK’s carbon capture and hydrogen cluster money is now aimed. What the next register will showThe 2024 file is a snapshot of an industrial landscape mid-demolition, and several of its biggest lines are already scheduled to shrink or vanish. Port Talbot’s blast furnaces have given way to an electric arc future, which should collapse its CO2, carbon monoxide and dust entries within a couple of reporting years; Scunthorpe’s trajectory points the same way. The offshore lines will decline with the basin. Set against that, the energy-from-waste fleet is still growing - the register’s second-largest CO2 sector has been its fastest-rising - and Drax’s tonnage depends on subsidy decisions rather than engineering. Watching those lines move, year on year, is precisely what a public register is for, and this analysis will be re-run against each new release. What it means for your money
How we did this, and what to checkWe parsed all 5,802 facility reports in the official 2024 PRTR dataset, collapsing every numbered release entry into a single table of facility, operator, substance, medium and quantity, then aggregated by site, parent company (merging inconsistent capitalisations), sector and nation. All quantities are reported to the register in kilograms per year and converted here to tonnes, kilotonnes and megatonnes. Methane and nitrous oxide CO2-equivalents use 100-year global warming potentials of 28 and 265 respectively. Every headline figure was recomputed in a second independent pass before publication. The register’s own caveats apply: thresholds exclude small sources, quantities are operator-reported under regulatory audit, and a facility’s presence records a lawful, permitted release, not a breach. Readers are welcome - encouraged - to download the register and check our arithmetic; that is what it is for. Analysis: Kael Tripton, from the UK Pollutant Release and Transfer Register (2024 reporting year) and Defra’s Carbon footprint for the UK and England to 2023 (30 June 2026). This article is general information, not investment, legal or environmental advice. Updated when the next register year publishes. Frequently asked questionsWho is the biggest polluter in the UK?By reported CO2, Drax power station in Yorkshire: 13.3 million tonnes in the 2024 register, one tonne in every eight reported by UK industry - though under carbon accounting rules its biomass emissions are booked differently from fossil CO2. Which companies emit the most CO2 in Britain?Drax Power (13.3 Mt), RWE (7.15 Mt across its gas stations), Uniper (5.07 Mt), Tata Steel (3.45 Mt) and Esso (3.07 Mt) lead the parent-company table, followed by British Steel, Valero, Phillips 66 and Essar. Which water company pollutes the most?Measured by nitrogen discharged to water in the 2024 register, Thames Water: 32,600 tonnes, more than the next two companies combined, led by the giant Beckton works in east London. Discharge scale partly reflects population served. What is the biggest methane source in the UK?Aberpergwm Colliery in South Wales - 13,000 tonnes of methane, three times the largest landfill, equivalent to roughly 360,000 tonnes of CO2 in warming terms. Does this register cover all UK pollution?No. It covers large facilities above reporting thresholds - about a quarter of territorial CO2. Road transport, home heating, offices and most agriculture sit outside it, which is why national totals are far larger. Where does the data come from?The official UK Pollutant Release and Transfer Register, compiled by the Environment Agency, Natural Resources Wales, SEPA and the energy department under the Kyiv Protocol, containing 5,802 operator-reported facility returns for 2024. Our full workings are described in the methodology section above. Read next |
Who Pollutes Britain? Every Major Emitter, Named and ChartedWe processed all 5,802 reports in the official UK pollution register. One power station emits a tonne in every eight, a Welsh coal mine out-gasses every landfill, and Thames Water tops the water table. 
Illustrative image. AI-generated and does not depict real people, places or events.
Editorial Disclaimer The content on Kaeltripton.com is for informational and educational purposes only and does not constitute financial, investment, tax, legal or regulatory advice. Kaeltripton.com is not authorised or regulated by the Financial Conduct Authority (FCA) and is not a financial adviser, mortgage broker, insurance intermediary or investment firm. Nothing on this site should be construed as a personal recommendation. Rates, figures and product details are indicative only, subject to change without notice, and should always be verified directly with the relevant provider, HMRC, the FCA register, the Bank of England, Ofgem or other appropriate authority before any financial decision is made. Past performance is not a reliable indicator of future results. If you require regulated financial advice, please consult a qualified adviser authorised by the FCA. 
|


