

UK energy suppliers reported £554 million of debt-related costs in January to March 2026, the second-highest quarter on record, Ofgem data shows. Bad debt made up £492 million of that, and total costs now run at around £1.6 billion a year against £457 million in 2019, a cost ultimately reflected in household bills.
TL;DR · LAST REVIEWED 22 July 2026
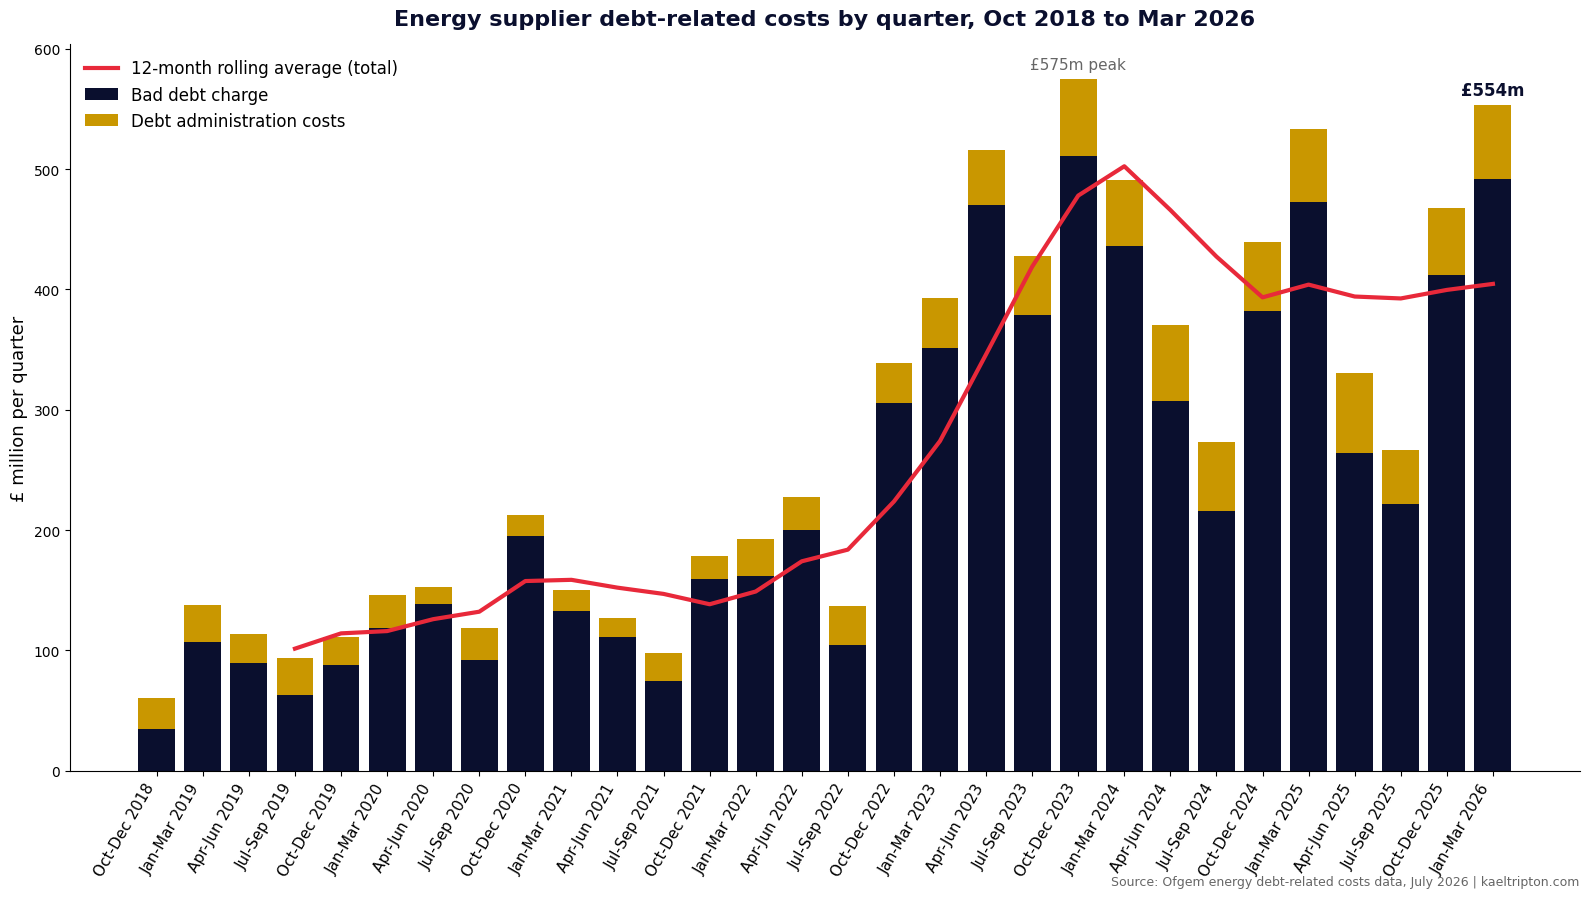
- Energy suppliers reported total debt-related costs of £554 million in the January to March 2026 quarter, second only to the £575 million record of October to December 2023, according to Ofgem data published in July 2026.
- The bad debt charge, unpaid bills suppliers do not expect to recover, was £492 million of the latest quarter, around 89% of the total, with debt administration costs at £62 million.
- Costs quadrupled through the gas crisis, rising from £137 million in the July to September 2022 quarter to the £575 million peak at the end of 2023.
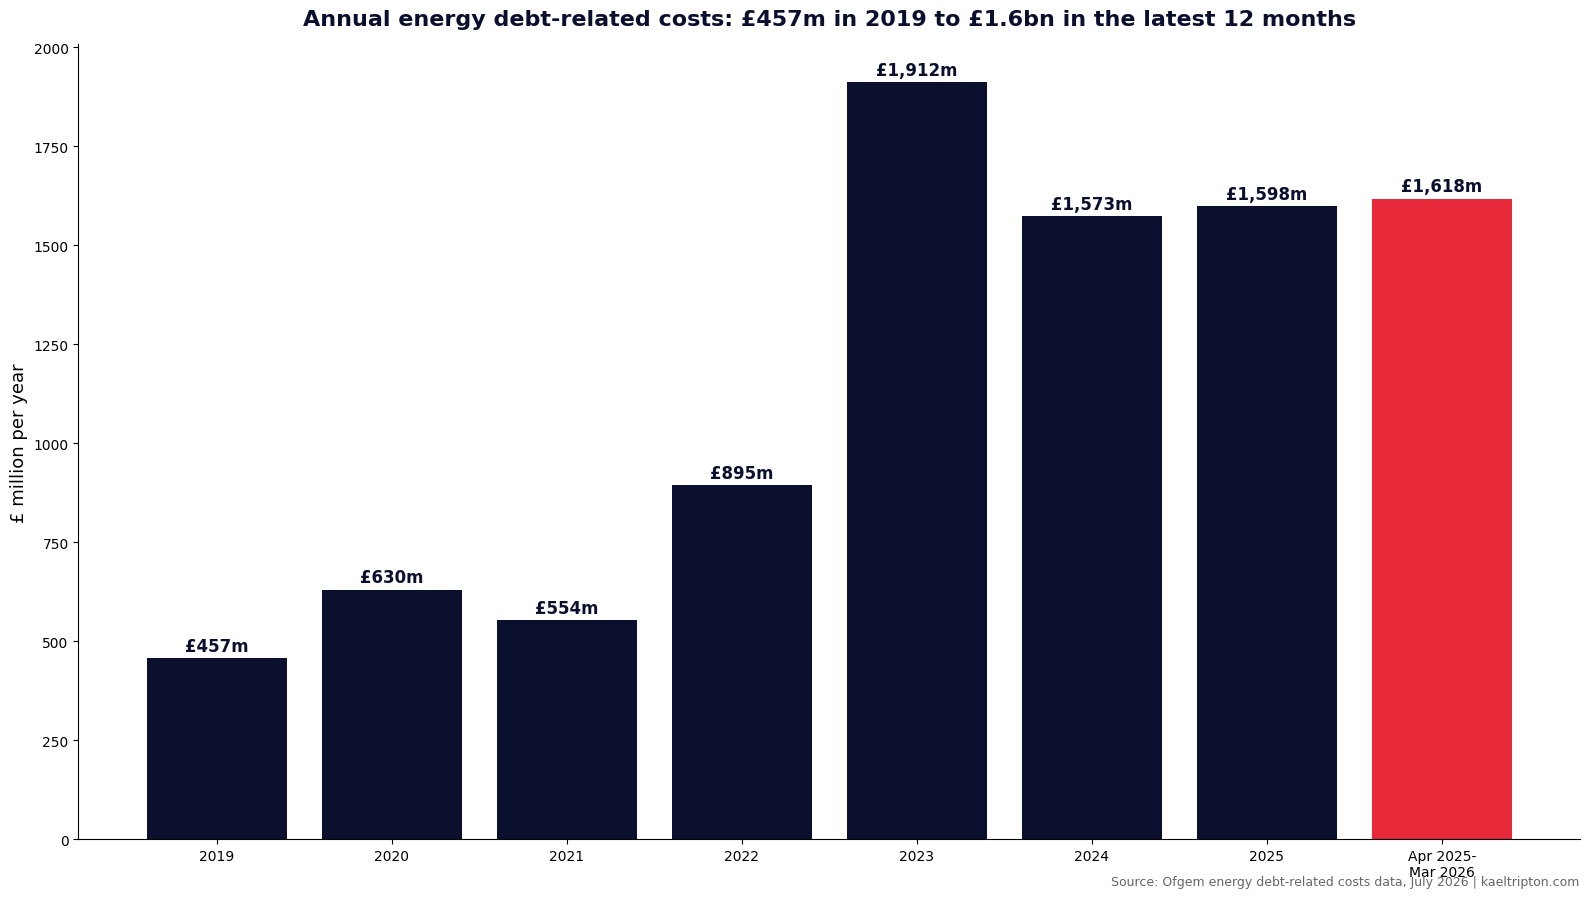
- On an annual basis, debt-related costs have risen from £457 million in 2019 to around £1.6 billion in the twelve months to March 2026, roughly 3.5 times higher.
- The 12-month rolling average has held around £400 million a quarter for the last year and a half, with large seasonal swings: bad debt fell £220 million between early and autumn 2024 then rose £260 million by early 2025.
- These costs feed into the debt-related allowance within the energy price cap, meaning they are ultimately spread across all customers' bills.
Annual energy supplier debt-related costs, 2019 to the twelve months to March 2026
| 2019 | £457m | Pre-crisis baseline year |
| 2020 | £630m | First pandemic year |
| 2021 | £553m | Supplier failures begin in late 2021 |
| 2022 | £895m | Gas crisis drives costs sharply higher from Q4 |
| 2023 | £1,912m | Peak year; record £575m quarter in Q4 |
| 2024 | £1,574m | Costs ease but remain far above pre-crisis levels |
| 2025 | £1,598m | Costs plateau around £400m a quarter on average |
| Apr 2025 to Mar 2026 | £1,618m | Latest twelve months, 3.5 times the 2019 level |
KEY FACTS
- Latest quarter (Jan to Mar 2026): total £553.7 million, comprising a £491.7 million bad debt charge and £62.0 million of debt administration costs
- Record quarter: £575 million in October to December 2023, at the height of the gas crisis impact
- Annual comparison: £457 million across 2019 against roughly £1.6 billion in the twelve months to March 2026
- 12-month rolling average: £405 million a quarter, broadly stable around £400 million since late 2024
- Coverage: Ofgem quarterly data request to retail suppliers with at least 100,000 default tariff customer accounts, covering all their customers on variable and fixed tariffs
How much are energy debt costs now
Suppliers reported £554 million of debt-related costs in the January to March 2026 quarter, the second-highest figure since Ofgem's records begin in late 2018, split between a £492 million bad debt charge and £62 million of debt administration costs.
Ofgem collects this data quarterly from every retail supplier with at least 100,000 default tariff customer accounts, covering all of their customers on both standard variable and fixed term tariffs, which makes it the most complete official measure of what unpaid energy bills cost the retail market. The latest release, covering October 2018 to March 2026, shows the January to March 2026 quarter at £553.7 million, behind only the £575 million recorded in October to December 2023. The first quarter of the year is consistently the most expensive in the series, reflecting winter consumption feeding through into unpaid bills: the three highest first quarters on record are 2026 at £554 million, 2025 at £534 million and 2024 at £491 million, against £138 million in the first quarter of 2019. The 12-month rolling average, which smooths that seasonality, stood at £405 million in the latest quarter and has held close to £400 million for around 18 months, a plateau at a level unimaginable before the gas crisis.
How much have costs risen since the gas crisis
Quarterly costs quadrupled between mid 2022 and the end of 2023, from £137 million to the record £575 million, and annual costs have gone from £457 million in 2019 to roughly £1.6 billion in the latest twelve months, 3.5 times the pre-crisis level.
The escalation is concentrated in an 18-month window. In the July to September 2022 quarter, as wholesale prices surged into bills, total debt-related costs were £137 million, not far above their pre-pandemic range. Five quarters later, in October to December 2023, they reached £575 million, a more than fourfold increase that Ofgem attributes mainly to the bad debt charge, the largest component of the total. On an annual view the shift is starker still: calendar year 2019 cost £457 million, while 2023 cost £1.9 billion, and the latest twelve months to March 2026 stand at £1.62 billion, roughly 3.5 times the 2019 baseline. What the annual figures also show is that the crisis did not fully unwind: 2024 at £1.57 billion and 2025 at £1.60 billion sit essentially flat against the peak year rather than falling back towards the pre-crisis norm, which is why the 12-month average line in the quarterly chart plateaus around £400 million rather than declining. Higher debt costs have, on this data, become a structural feature of the retail energy market rather than a temporary crisis effect.
What is driving the costs: bad debt or administration
Bad debt dominates: the £492 million bad debt charge was around 89% of the latest quarter's total, while debt administration costs, though up from £26 million to £62 million a quarter since 2018, remain the smaller component.
Ofgem's definitions separate the two components cleanly. The bad debt charge is the change in the amount of unpaid bills a supplier does not expect to recover, movements in provisions, plus debts newly written off as unrecoverable. Debt administration covers the operational cost of chasing what is owed: legal and warrant costs, field visits, communications, setting up payment plans, debt collection agencies and credit delivery costs. The bad debt charge is by far the larger and more volatile element, swinging with energy consumption and provisioning decisions, while administration costs have climbed more steadily, from £26 million a quarter at the start of the series to a peak of £67 million in mid 2025 and £62 million in the latest quarter, an increase of around 2.4 times. The recent quarters below show the pattern: totals swing by £200 million or more between seasons while the 12-month average barely moves.
| Quarter | Bad debt charge | Debt admin | Total | 12-month average |
| Apr-Jun 2024 | £307.6m | £62.7m | £370.3m | £466m |
| Jul-Sep 2024 | £215.9m | £56.9m | £272.8m | £427m |
| Oct-Dec 2024 | £381.8m | £57.4m | £439.2m | £393m |
| Jan-Mar 2025 | £472.5m | £61.1m | £533.6m | £404m |
| Apr-Jun 2025 | £264.0m | £66.6m | £330.6m | £394m |
| Jul-Sep 2025 | £221.5m | £44.9m | £266.4m | £392m |
| Oct-Dec 2025 | £412.4m | £55.2m | £467.6m | £400m |
| Jan-Mar 2026 | £491.7m | £62.0m | £553.7m | £405m |
Last eight quarters. Figures rounded to £0.1 million. Source: Ofgem energy debt-related costs data, July 2026.
Why are debt costs stable while household energy debt keeps rising
Because they measure different things: the widely reported £4 billion plus of customer debt and arrears is a stock of money owed at a point in time, while the bad debt charge is a flow onto suppliers' profit and loss accounts, shaped by provisioning rates, write-offs and recoveries.
Ofgem addresses this apparent contradiction directly in the release. The total value of customer debt and arrears, the figure that has drawn headlines as it has climbed, measures the stock of money owed by customers to suppliers at a moment in time. The bad debt charge in this dataset instead measures a flow: what suppliers recognise on their profit and loss accounts each quarter as unlikely to be recovered. The two can move differently because the charge depends on more than the change in debts and arrears; it reflects provisioning rate decisions, debts actually written off, recoveries of money previously provided for, and the recognition of credit balances. A supplier can therefore face a growing stock of arrears while its quarterly charge holds steady, if provisioning already anticipates the losses or recoveries offset new provisions. The seasonal pattern is visible in the numbers Ofgem highlights: the bad debt charge fell by £220 million between the first and third quarters of 2024 as winter bills washed through, then rose by £260 million by the first quarter of 2025 as the next winter's consumption arrived. Neither swing changed the underlying trend, which is the £400 million a quarter plateau.
What do supplier debt costs mean for household bills
Debt-related costs are recovered through the debt allowance within the energy price cap, so the roughly £1.6 billion annual cost is ultimately spread across all households' bills, including those who pay in full and on time.
Suppliers do not simply absorb these costs. The energy price cap that governs default tariffs includes a debt-related cost allowance, sized with reference to the costs efficient suppliers actually incur, which is one reason Ofgem collects this data at all. When bad debt runs at four times its pre-crisis level year after year, the allowance that recovers it sits inside every capped bill, which means customers who pay promptly are collectively covering the bills that go unpaid. This dataset excludes one further element, the working capital cost of carrying debt, which forms part of the price cap's debt allowance but is not included in the figures here, so the full cost to bills of customer debt is somewhat higher than the numbers above. For households, the practical takeaways are two. First, the scale: unpaid energy bills are now a £1.6 billion a year cost being socialised across the market. Second, the direction: with the 12-month average flat around £400 million a quarter for 18 months, there is no sign in this data of debt costs returning to pre-crisis levels, and the next quarterly release will show whether the record first quarter of 2026 marks a new step up or the top of the seasonal cycle.
RELATED GUIDES
DISCLAIMER
This article is for general information only and does not constitute financial advice. Figures are drawn from Ofgem's published debt-related costs dataset and are subject to revision by Ofgem. Anyone struggling with energy bills can contact their supplier, who is required to offer support, or seek free debt advice.
Frequently asked questions
How much do unpaid energy bills cost each year
Around £1.6 billion in the twelve months to March 2026, according to Ofgem's debt-related costs data, made up of suppliers' bad debt charges and debt administration costs. That compares with £457 million across 2019.
What is a bad debt charge in energy
The change in the amount of unpaid bills a supplier does not expect to recover, movements in provisions, plus debts newly confirmed as unrecoverable and written off. It was £492 million in the January to March 2026 quarter, around 89% of total debt-related costs.
Do other customers pay for unpaid energy bills
In effect, yes. Debt-related costs are recovered through the debt allowance within the energy price cap, so the cost of unpaid bills is spread across all customers, including those who pay in full and on time.
Why do energy debt costs peak in winter
The bad debt charge follows seasonal consumption: higher winter usage produces larger bills and more unpaid amounts. January to March is consistently the most expensive quarter, and bad debt swung by £220 million down and £260 million up across the 2024 to 2025 seasons.
Which suppliers are included in Ofgem's debt cost data
Retail energy suppliers with at least 100,000 default tariff customer accounts, reporting quarterly. The figures cover all of their customers, on both standard variable and fixed term tariffs, but exclude working capital costs.
SOURCES
- Ofgem, energy debt-related costs data, October 2018 to March 2026 - accessed 22 July 2026
- Ofgem, energy price cap - accessed 22 July 2026
- Ofgem, Office of Gas and Electricity Markets - accessed 22 July 2026


