

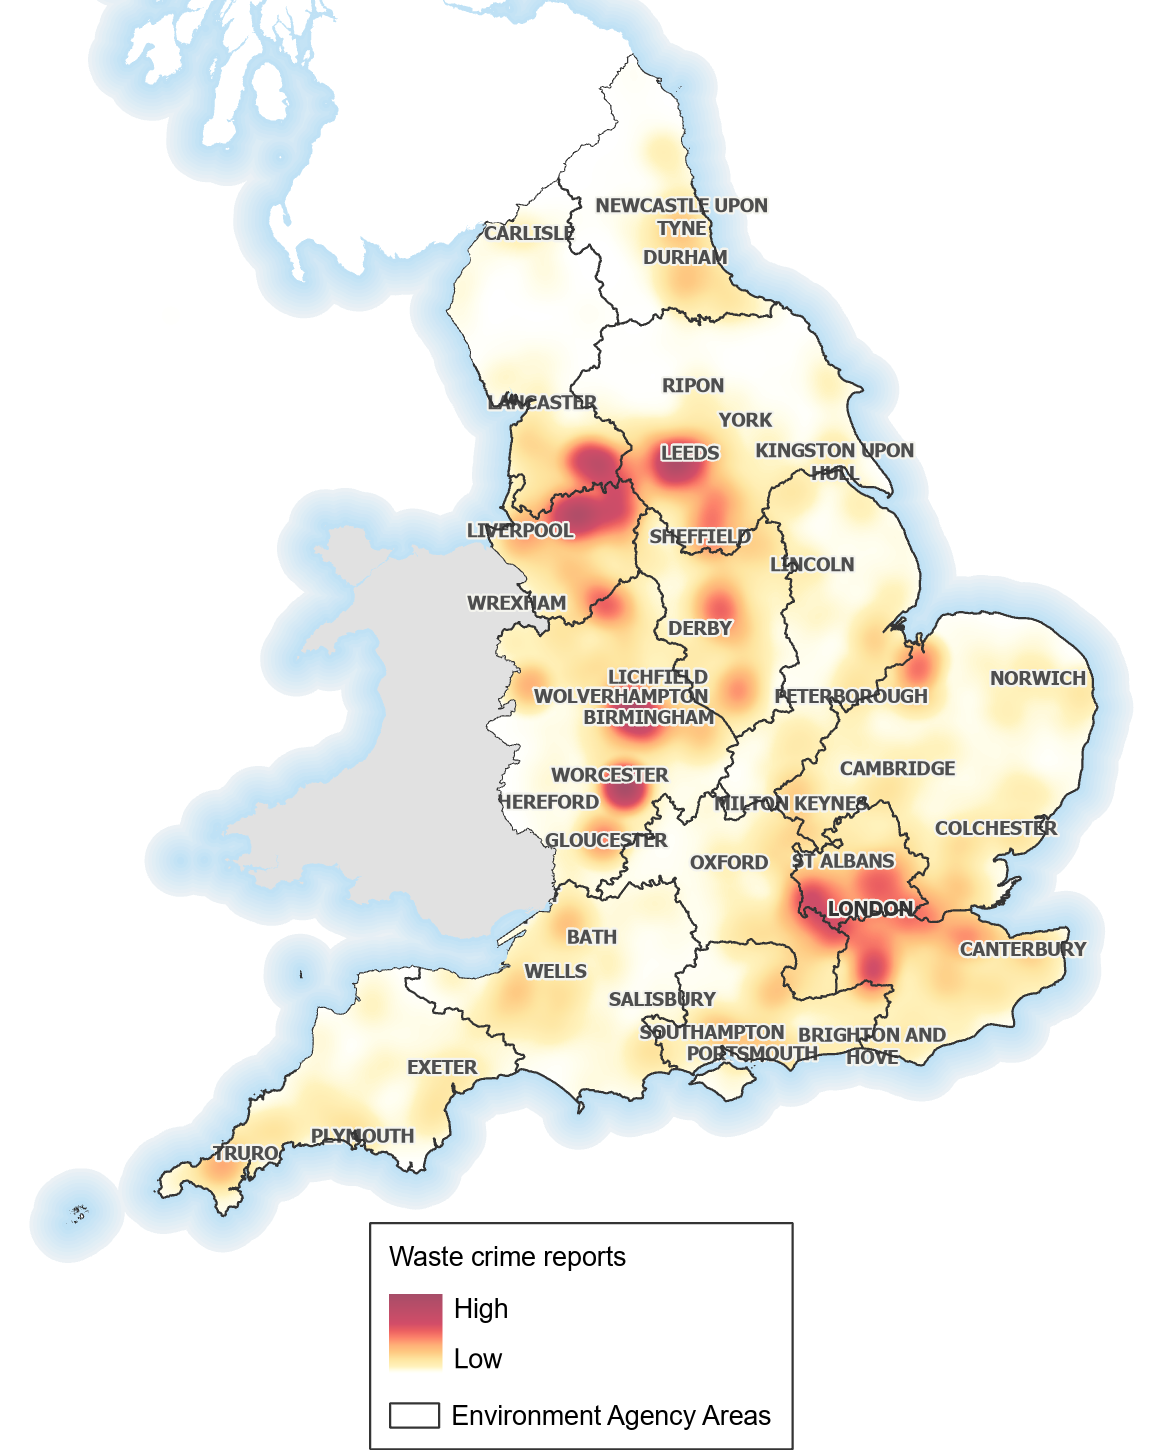
A waste crime heat map turns thousands of individual public reports into a single picture of England, shaded darkest where reports of suspected dumping, carrying or burning cluster most densely. The Environment Agency's 2026 map is built from the 10,238 reports it received in 2025, and it exists to point limited enforcement at the areas generating the most intelligence.
TL;DR · LAST REVIEWED 2 SEPTEMBER 2026
- A heat map is a density picture: England shaded darkest where waste crime reports cluster, not a simple list of totals.
- It is built from public reports (10,238 in 2025), so it maps where crime is REPORTED, not necessarily where it happens.
- That is its power and its blind spot: hotspots guide enforcement, but only about 27 per cent of waste crime is reported.
Waste crime in England: the 2025 heat map figures
| Measure | Figure |
| Total suspected waste crime reports, 2025 | 10,238 |
| Highest region: West Midlands | 1,542 reports |
| Second: Yorkshire | 1,068 reports |
| Estimated share of waste crimes reported | around 27 per cent |
| Maximum fine (rising) | from £300 to £5,000 |
| Digital waste tracking service | from October 2026 |
Source: Environment Agency and GOV.UK, 2 September 2026
KEY FACTS
- A heat map shades a map of England by the density of public reports, so clusters stand out visually rather than as a table.
- The Environment Agency's map is built from 10,238 reports of suspected waste crime received in 2025.
- It measures reporting, not confirmed crime: only an estimated 27 per cent of waste crime is ever reported.
- The West Midlands (1,542) and Yorkshire (1,068) were the darkest regions on the 2025 map.
- The map directs enforcement, drones and officers to the areas generating the most intelligence.
What a heat map actually is
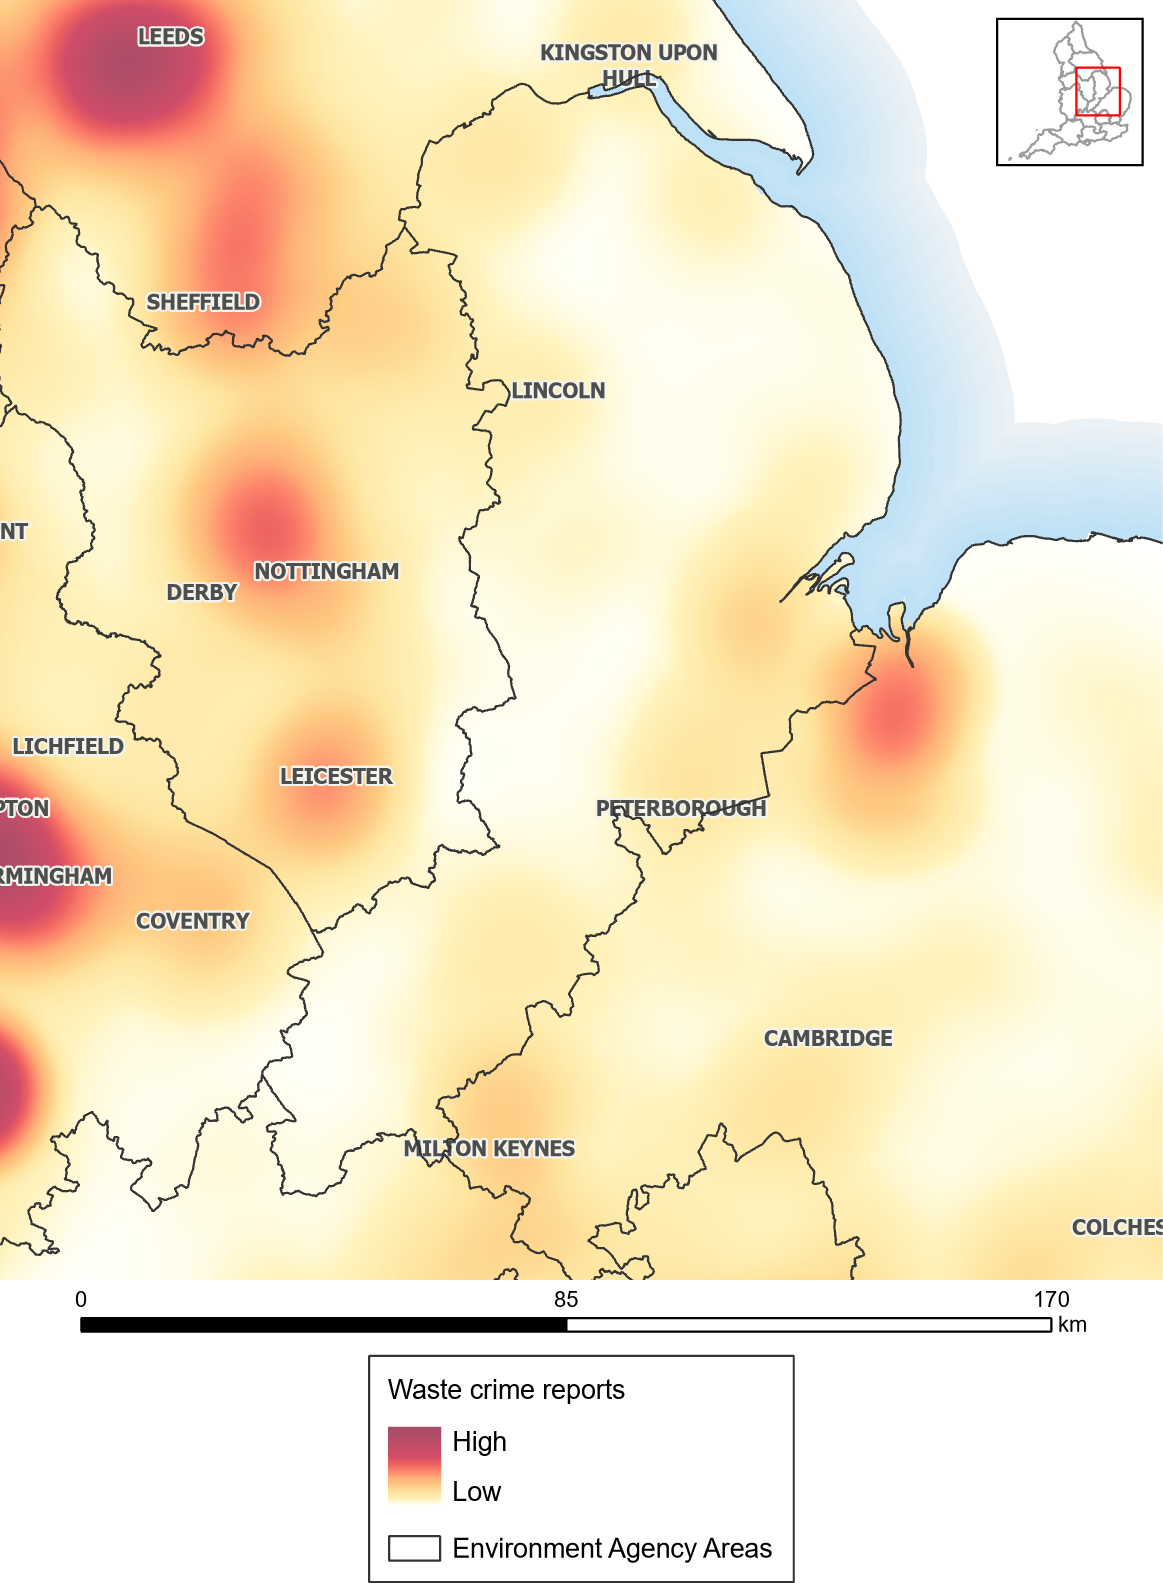
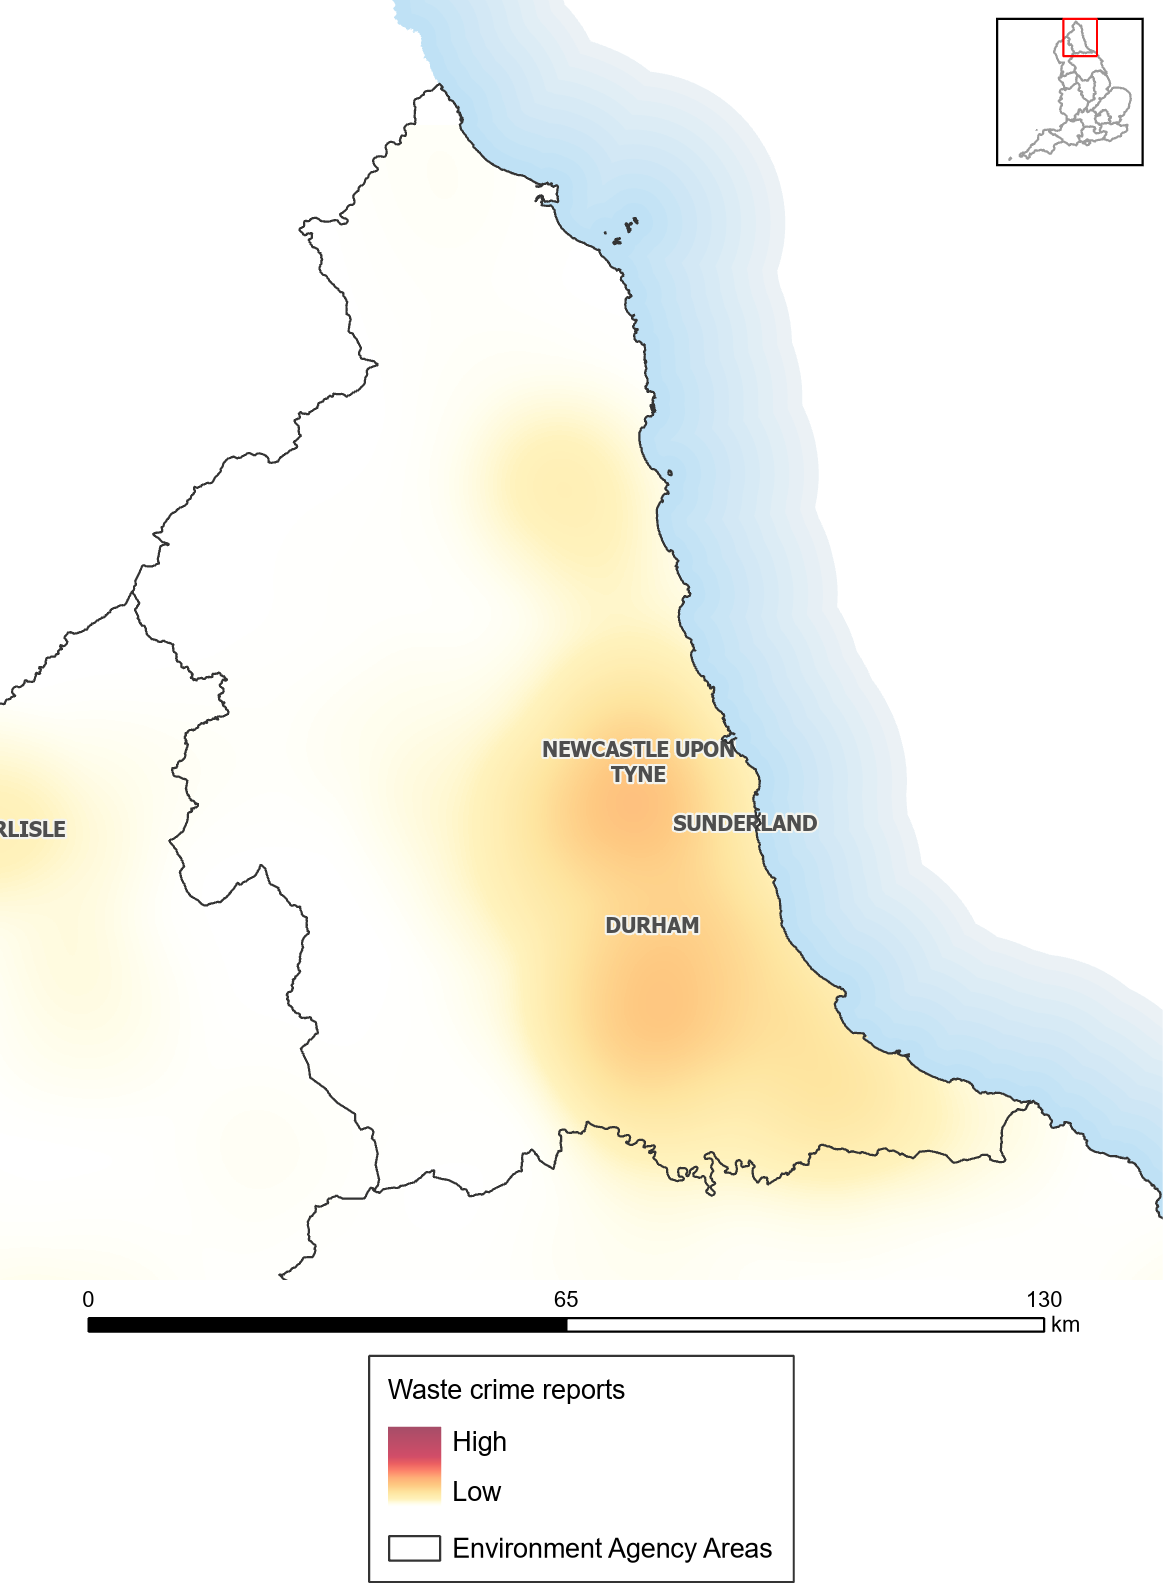
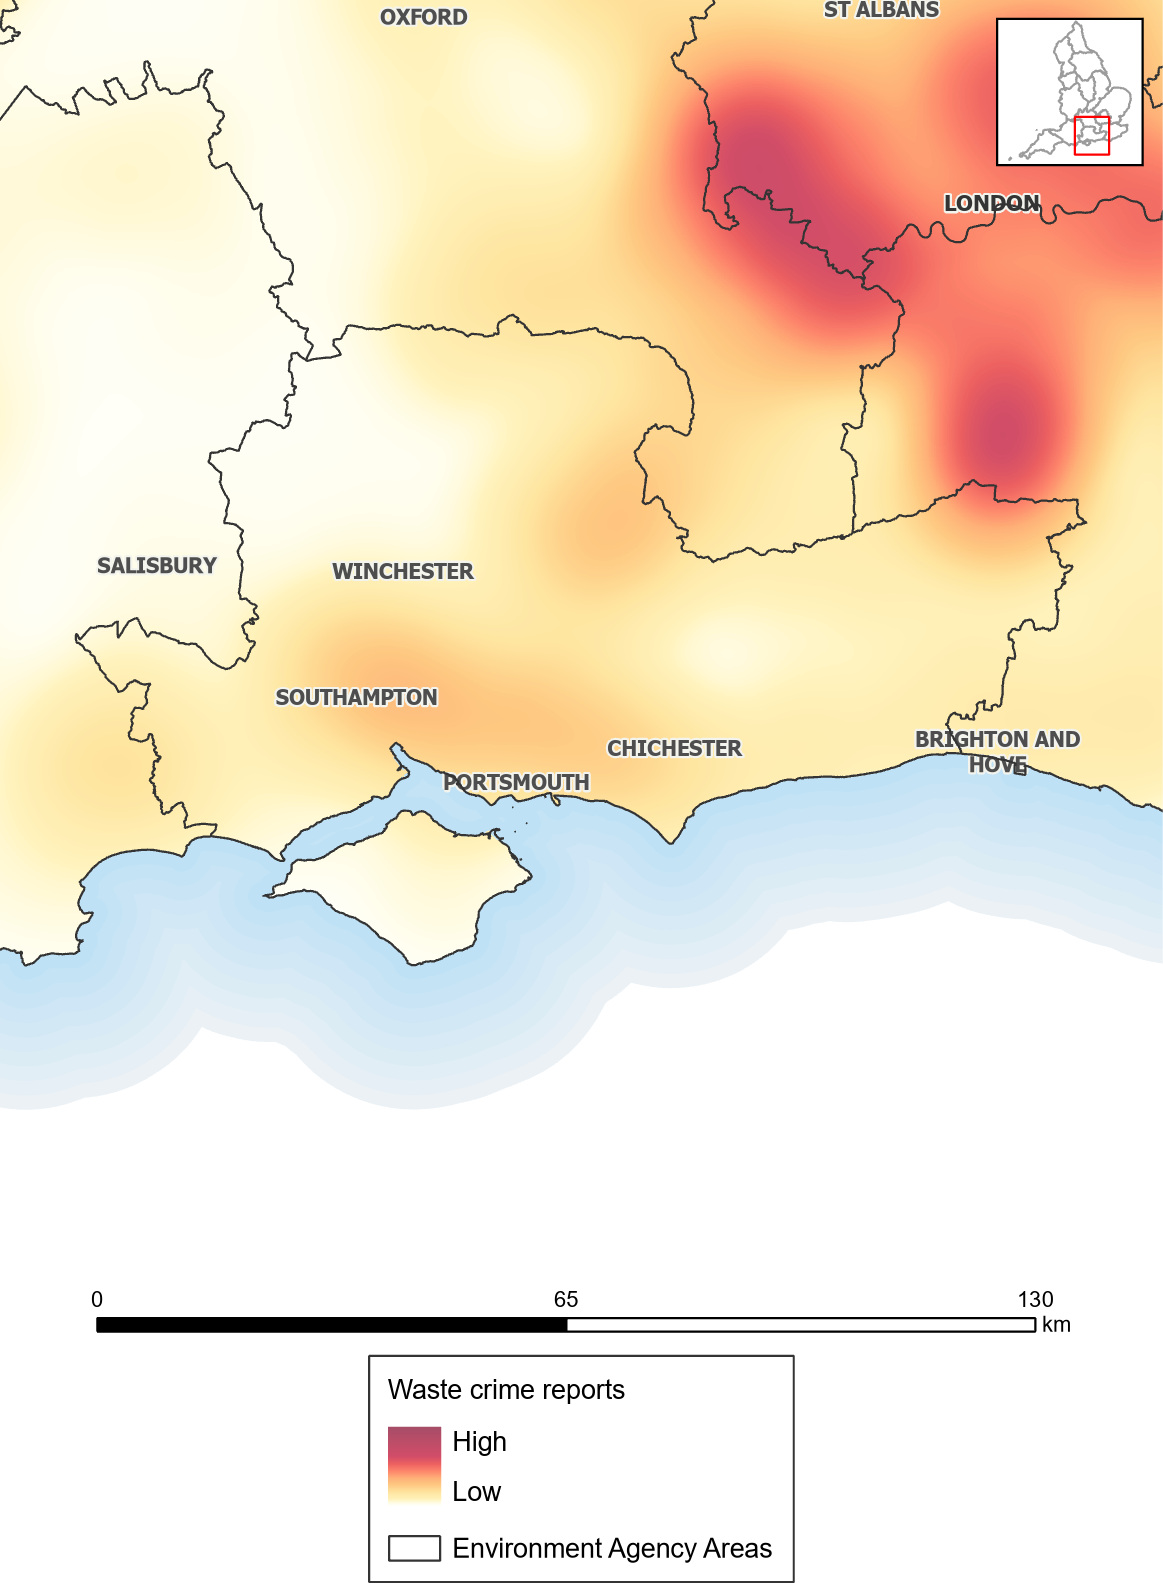
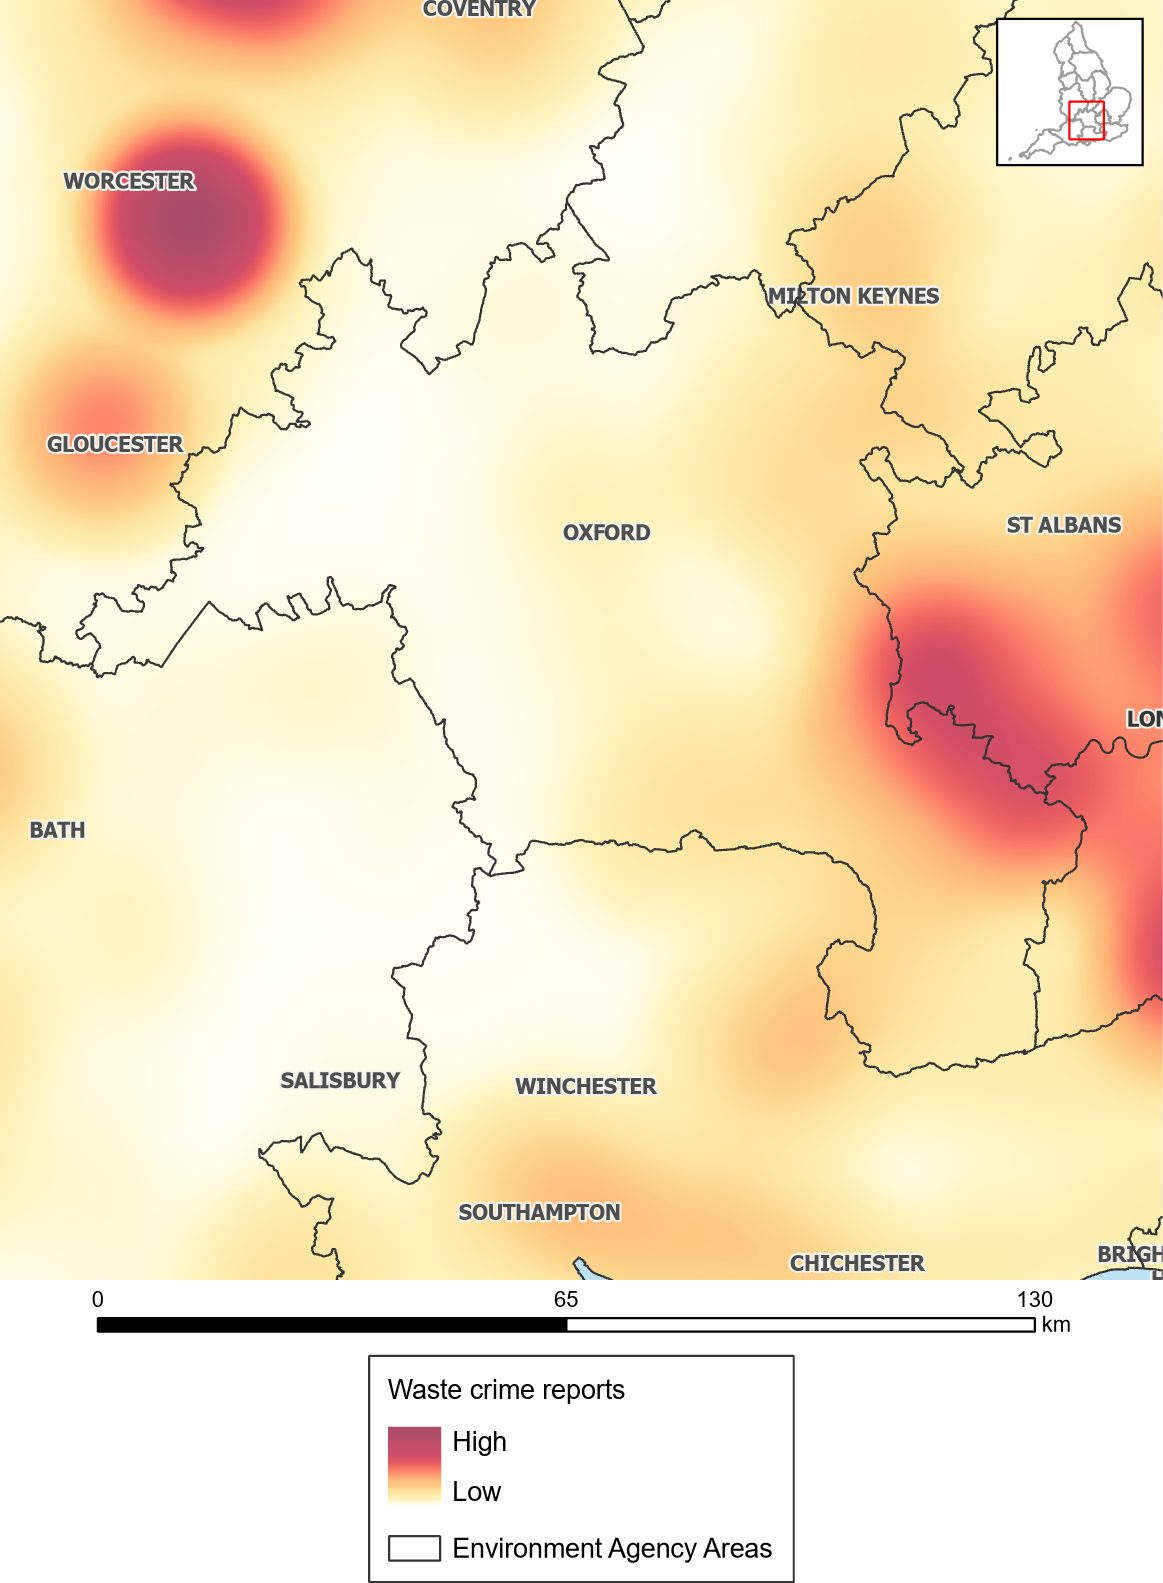
A heat map is not a table of totals dressed up with colour; it is a density visualisation. Each report of suspected waste crime is tied to the general area a person was calling from, and where many reports fall close together, the map is shaded more intensely, so a single glance at England shows where the problem concentrates. Two areas with the same headline count can look very different: a hundred reports spread thinly across a county barely registers, while a hundred reports clustered on a few streets burns a dark spot into the map. That clustering is the signal the Environment Agency is looking for, because organised waste crime tends to repeat in the same places rather than scatter at random.
How the Environment Agency builds one
The map is built from the bottom up, out of public intelligence. Every call to the Agency's incident hotline between 1 January and 31 December 2025 is plotted by the general area the caller was in, and aggregating those 10,238 reports produces the density surface behind the map. The maps deliberately do not pinpoint exact incident locations, only where people were when they reported. The crucial consequence is that the map records where waste crime is reported, not where it is proven or even where it necessarily happens: the reports include duplicates and crimes the Agency passes to councils, such as small fly-tips. The colour is a measure of attention as much as of crime, which is why the Agency publishes it annually rather than treating any single year as the last word.
What it reveals, and its blind spots
Read carefully, the map is powerful. Persistent dark areas across successive years point to established criminal operations rather than one-off fly-tips, and that pattern lets the Agency distinguish a nuisance from an organised gang. But the same construction creates blind spots. A hotspot can reflect an engaged, watchful community that reports diligently as much as it reflects the worst offending, while a genuinely bad but isolated site can stay pale on the map if nobody sees it. With only around 27 per cent of waste crime reported, the quietest corners are not necessarily the cleanest. The concealed dump of roughly 30,000 tonnes found at Cave's Inn Pits in Leicestershire, spotted only after residents reported an odour, is precisely the kind of site a report-driven map can miss until someone speaks up.
The picture across England's regions
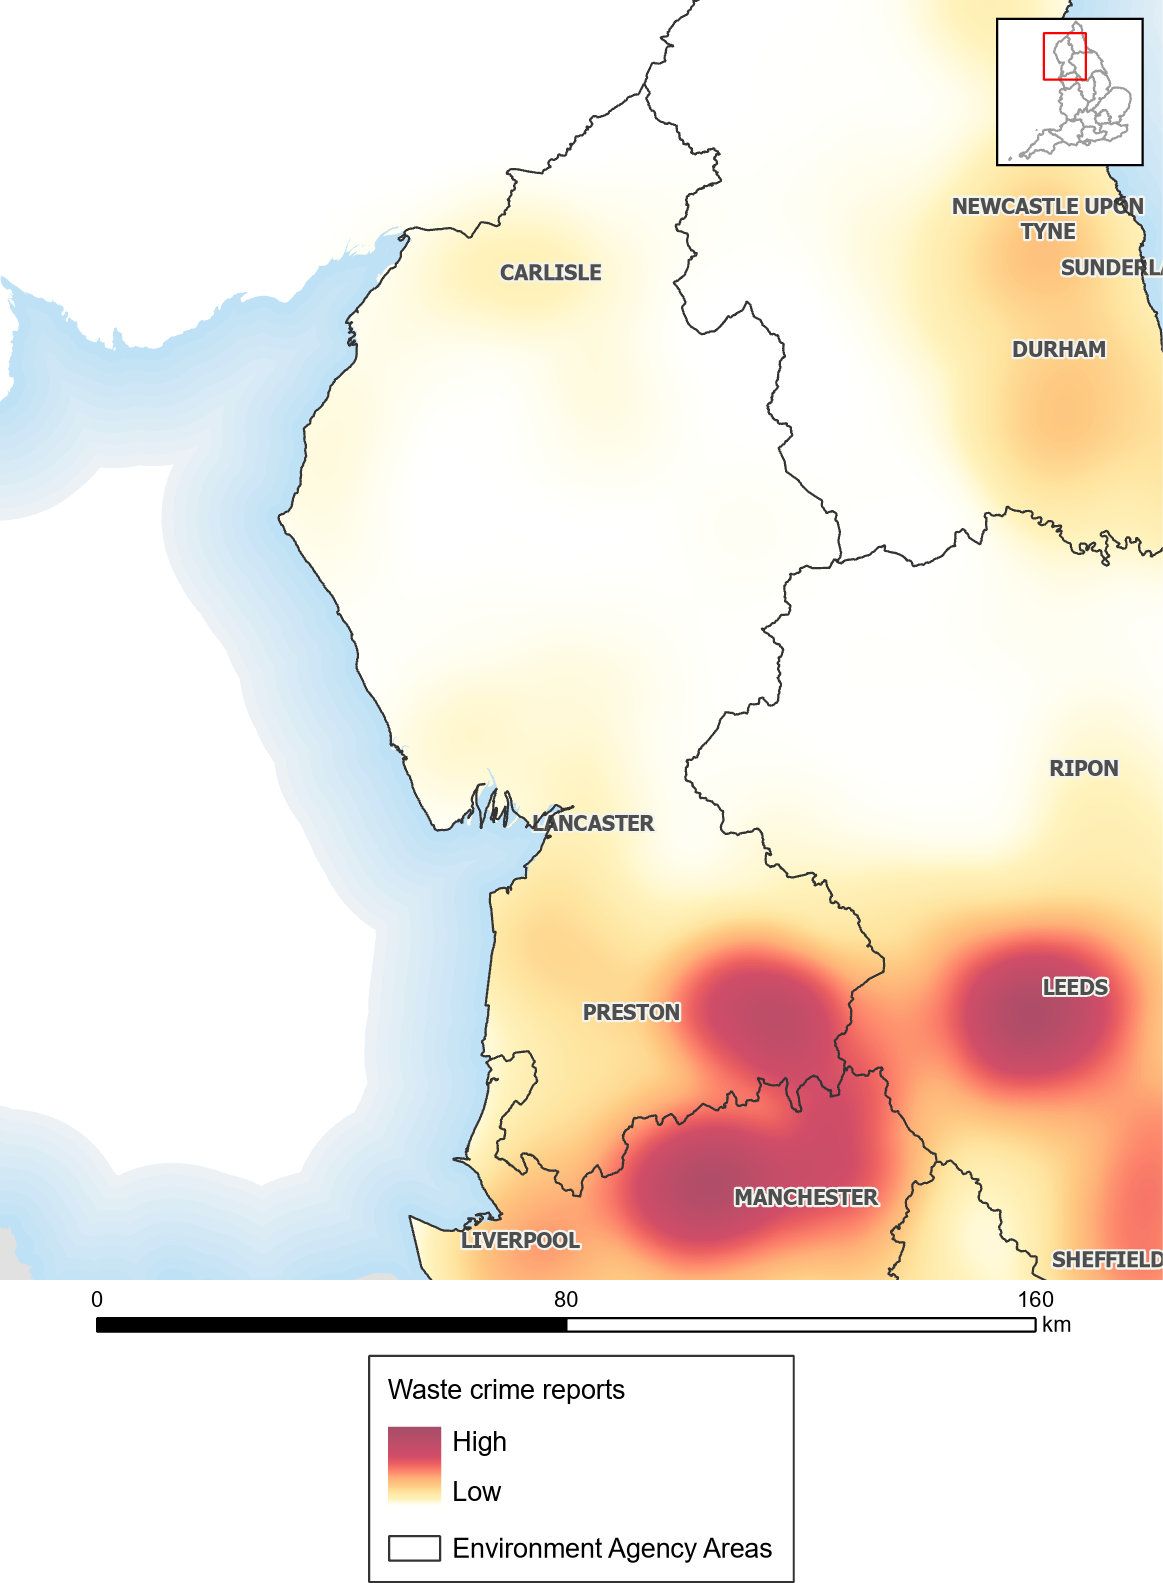
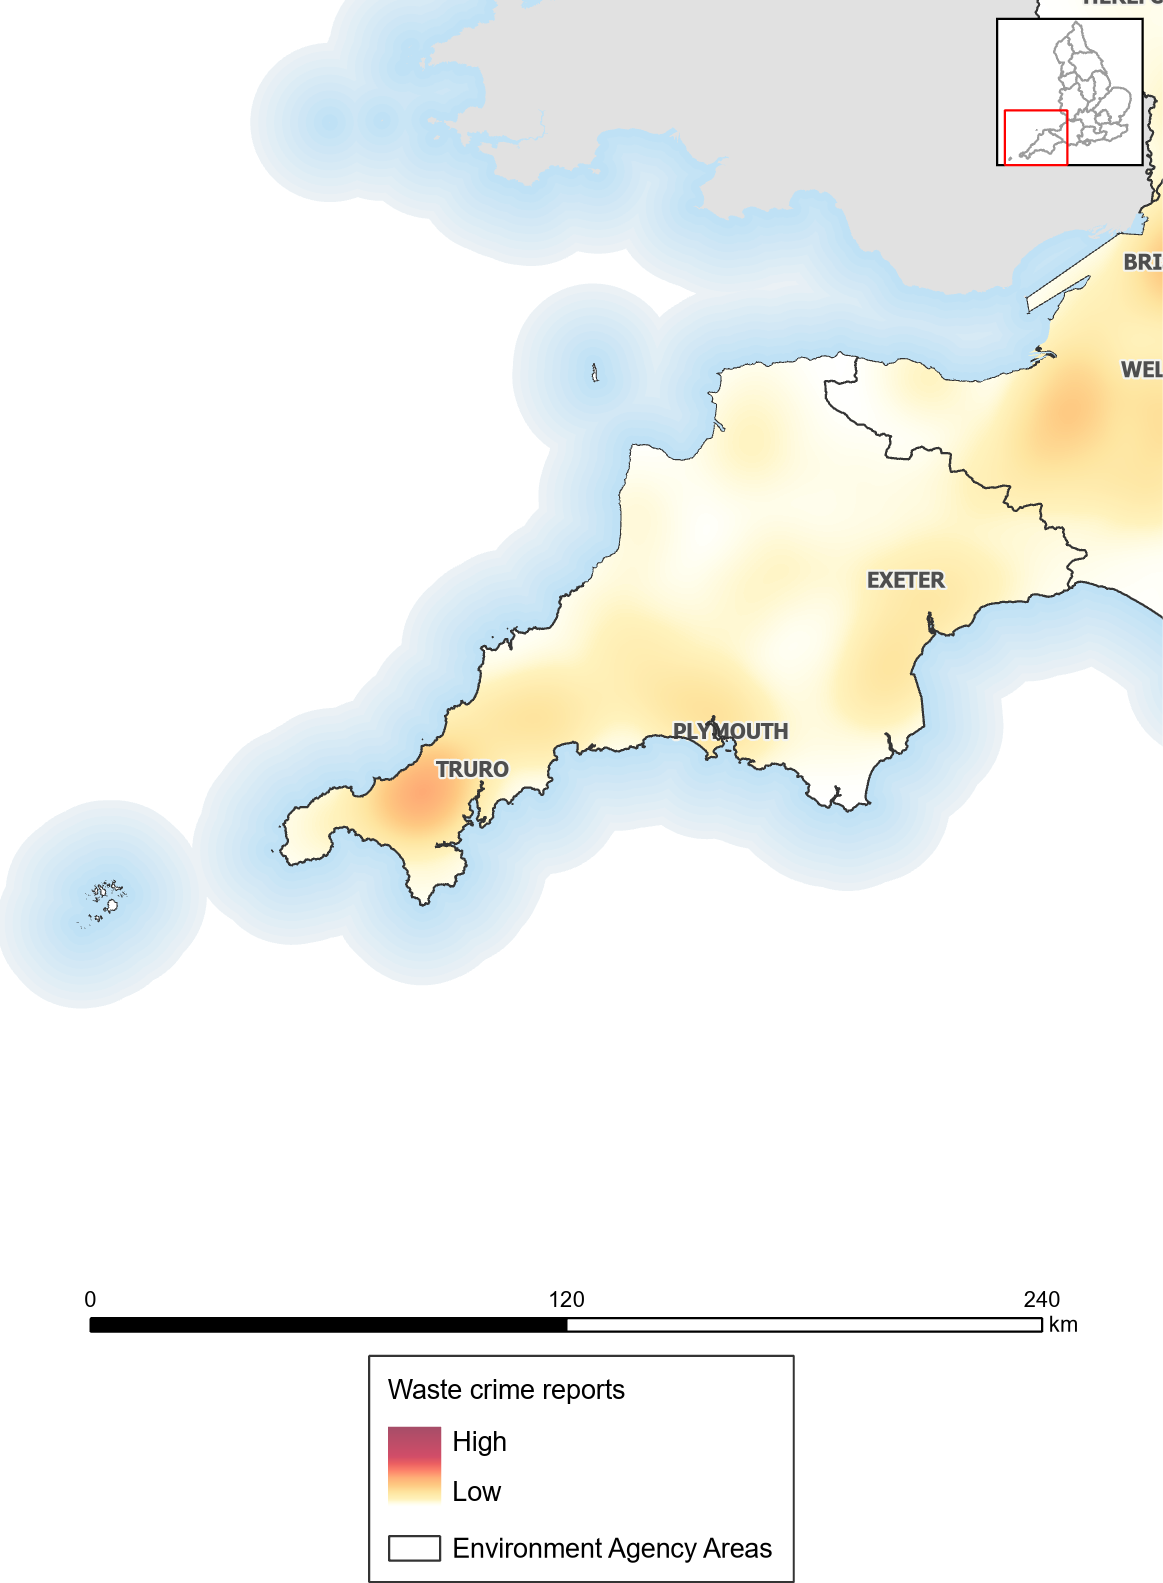
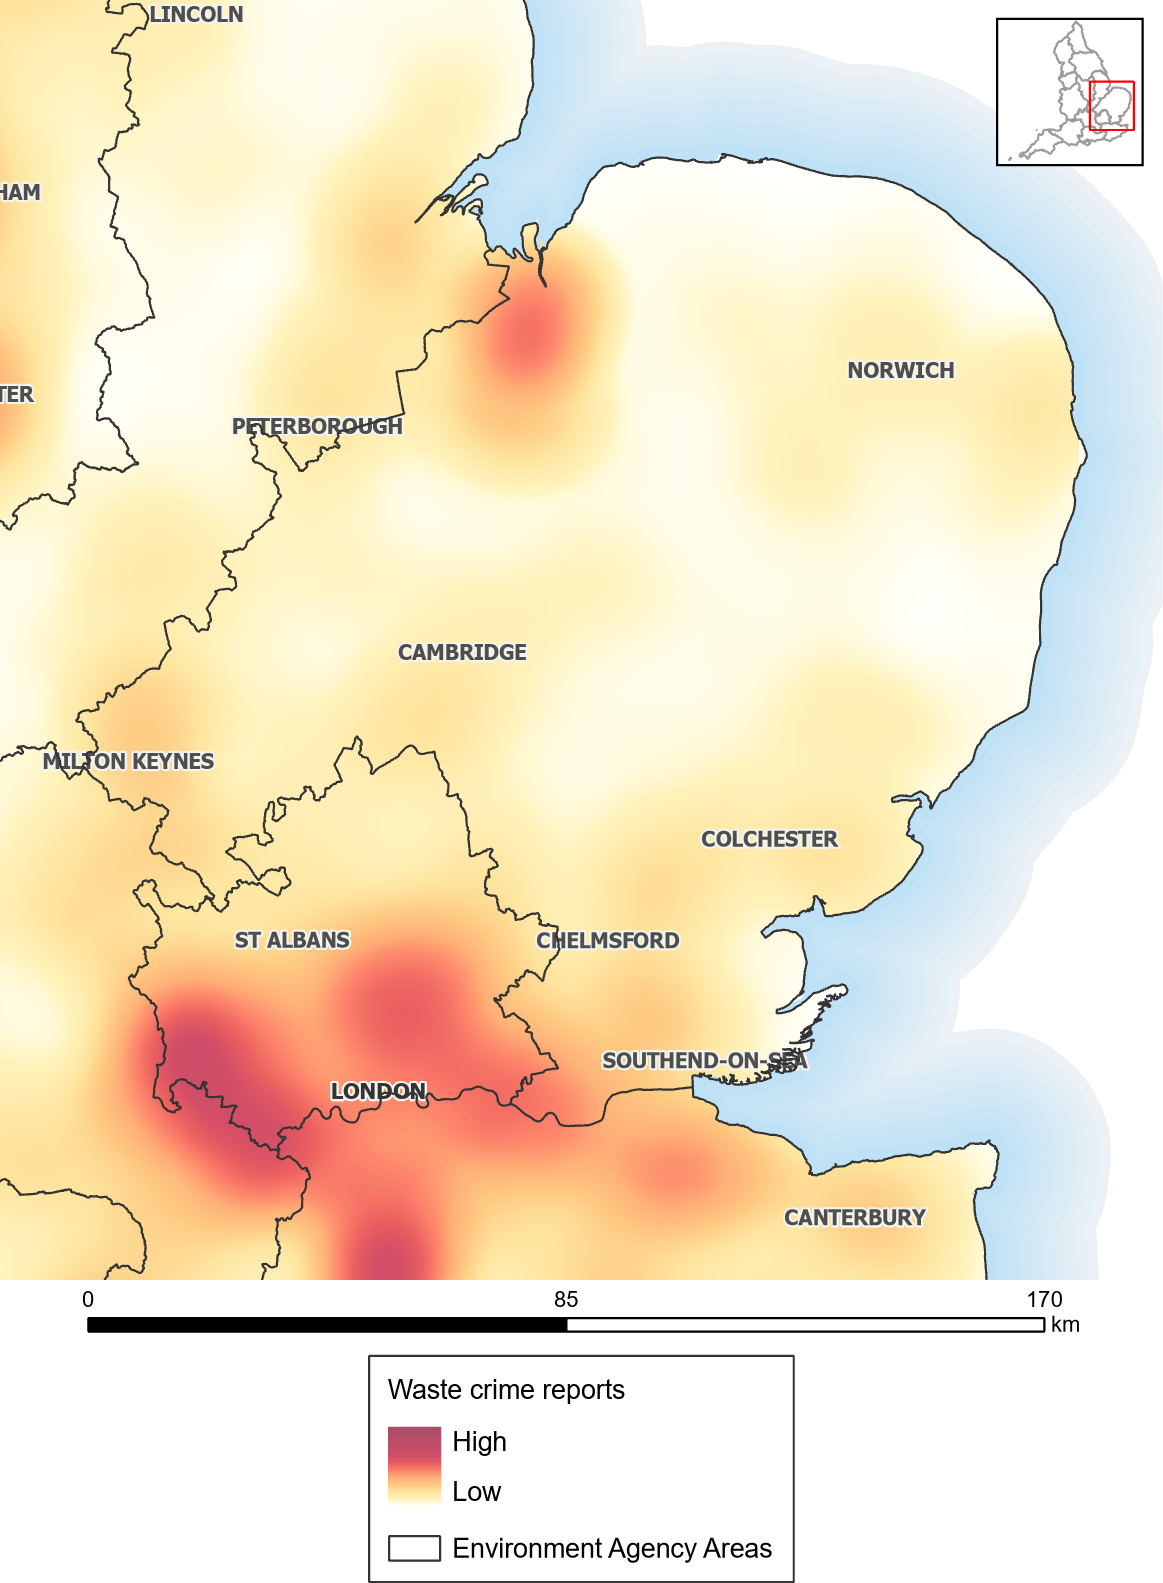
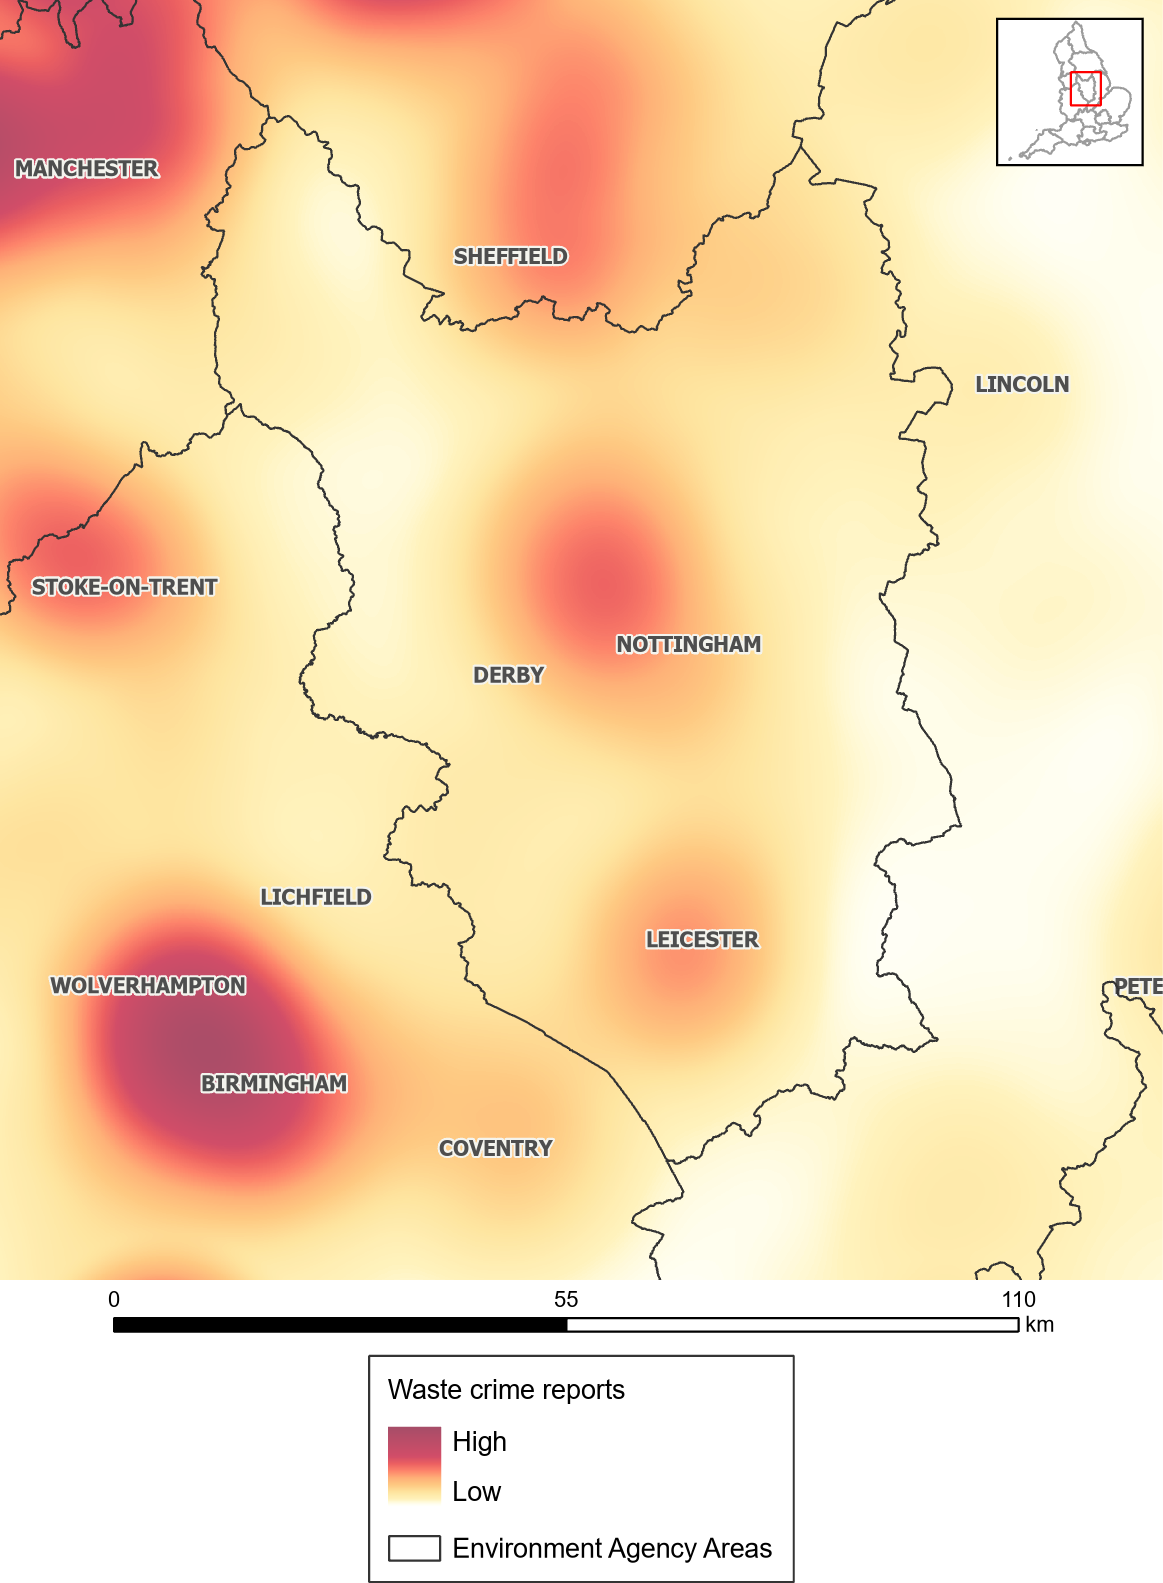
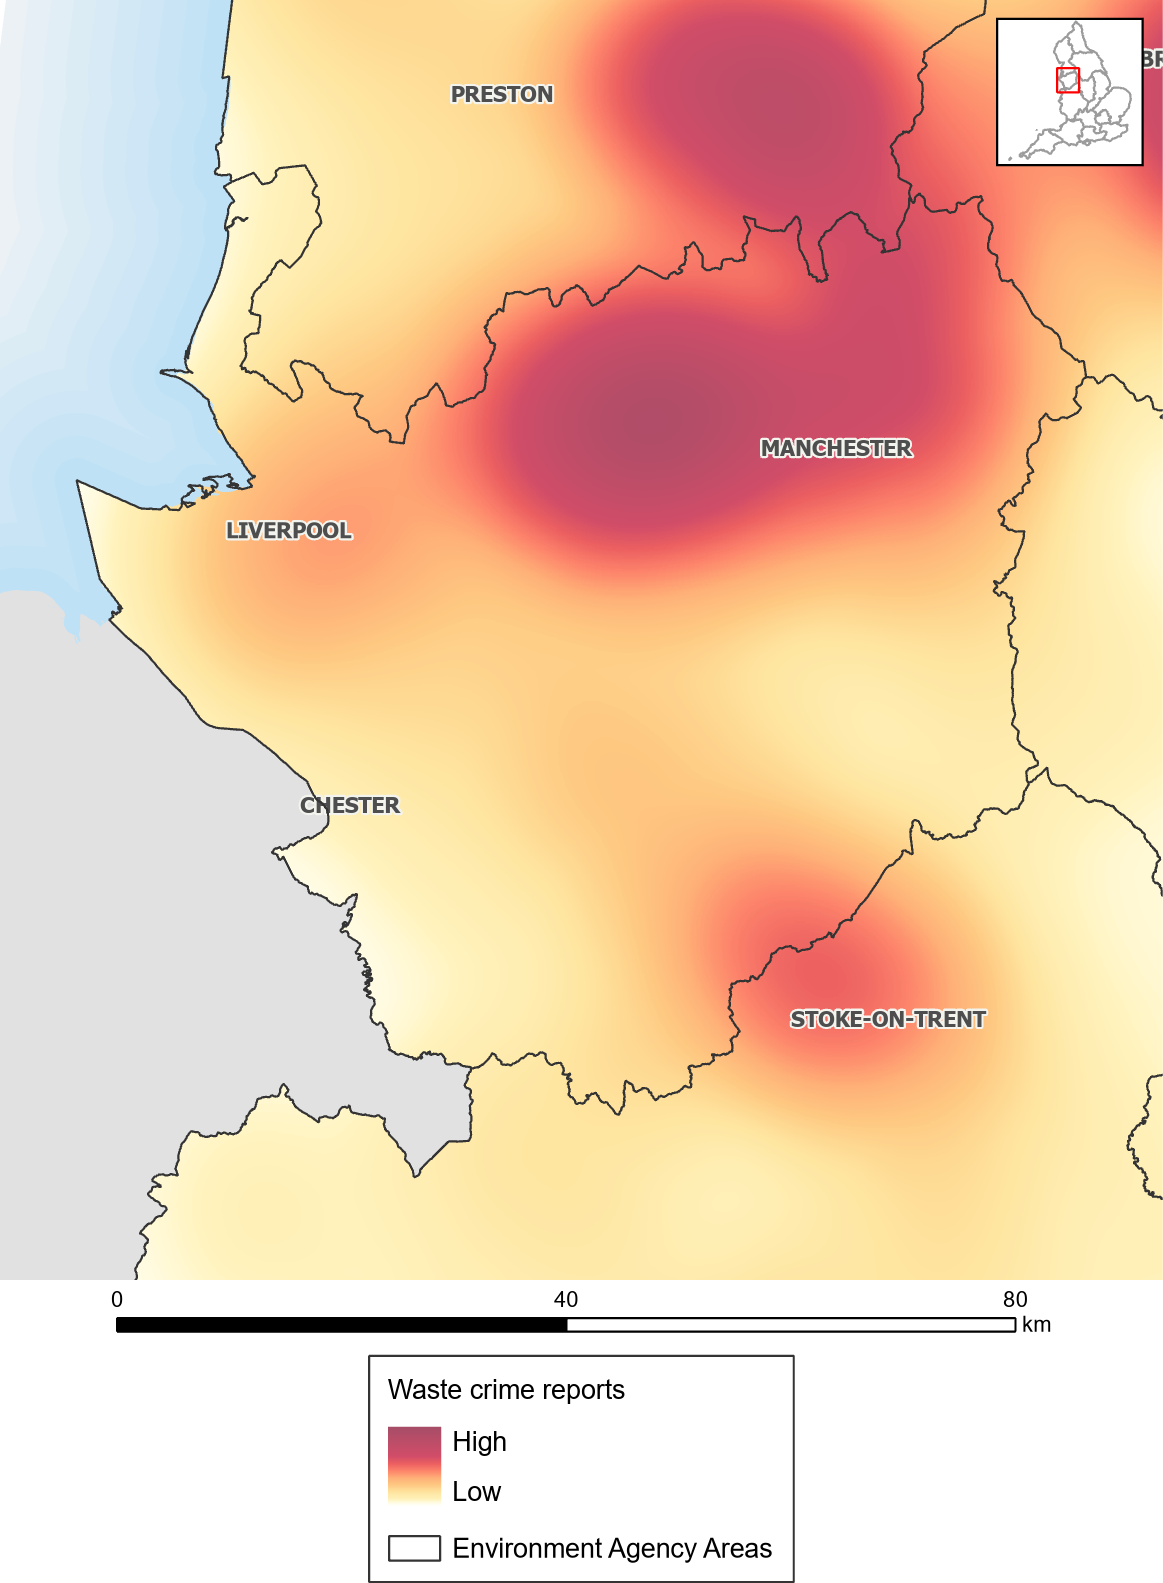
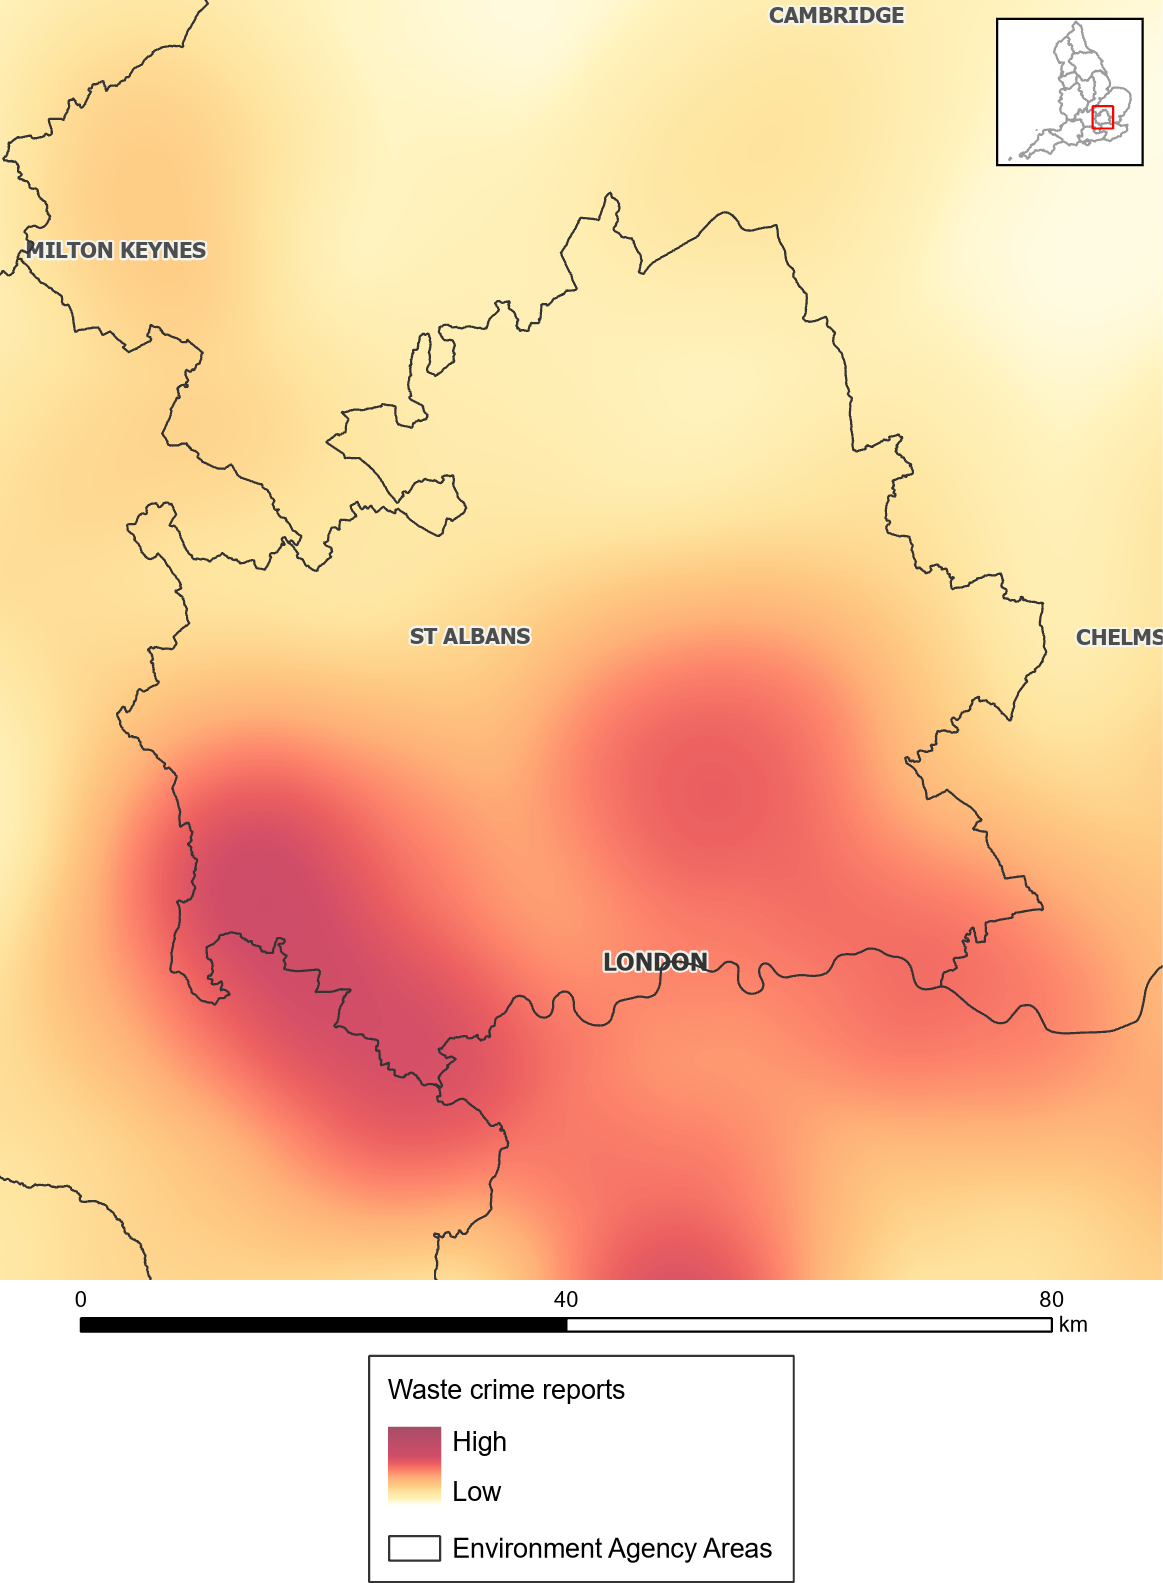
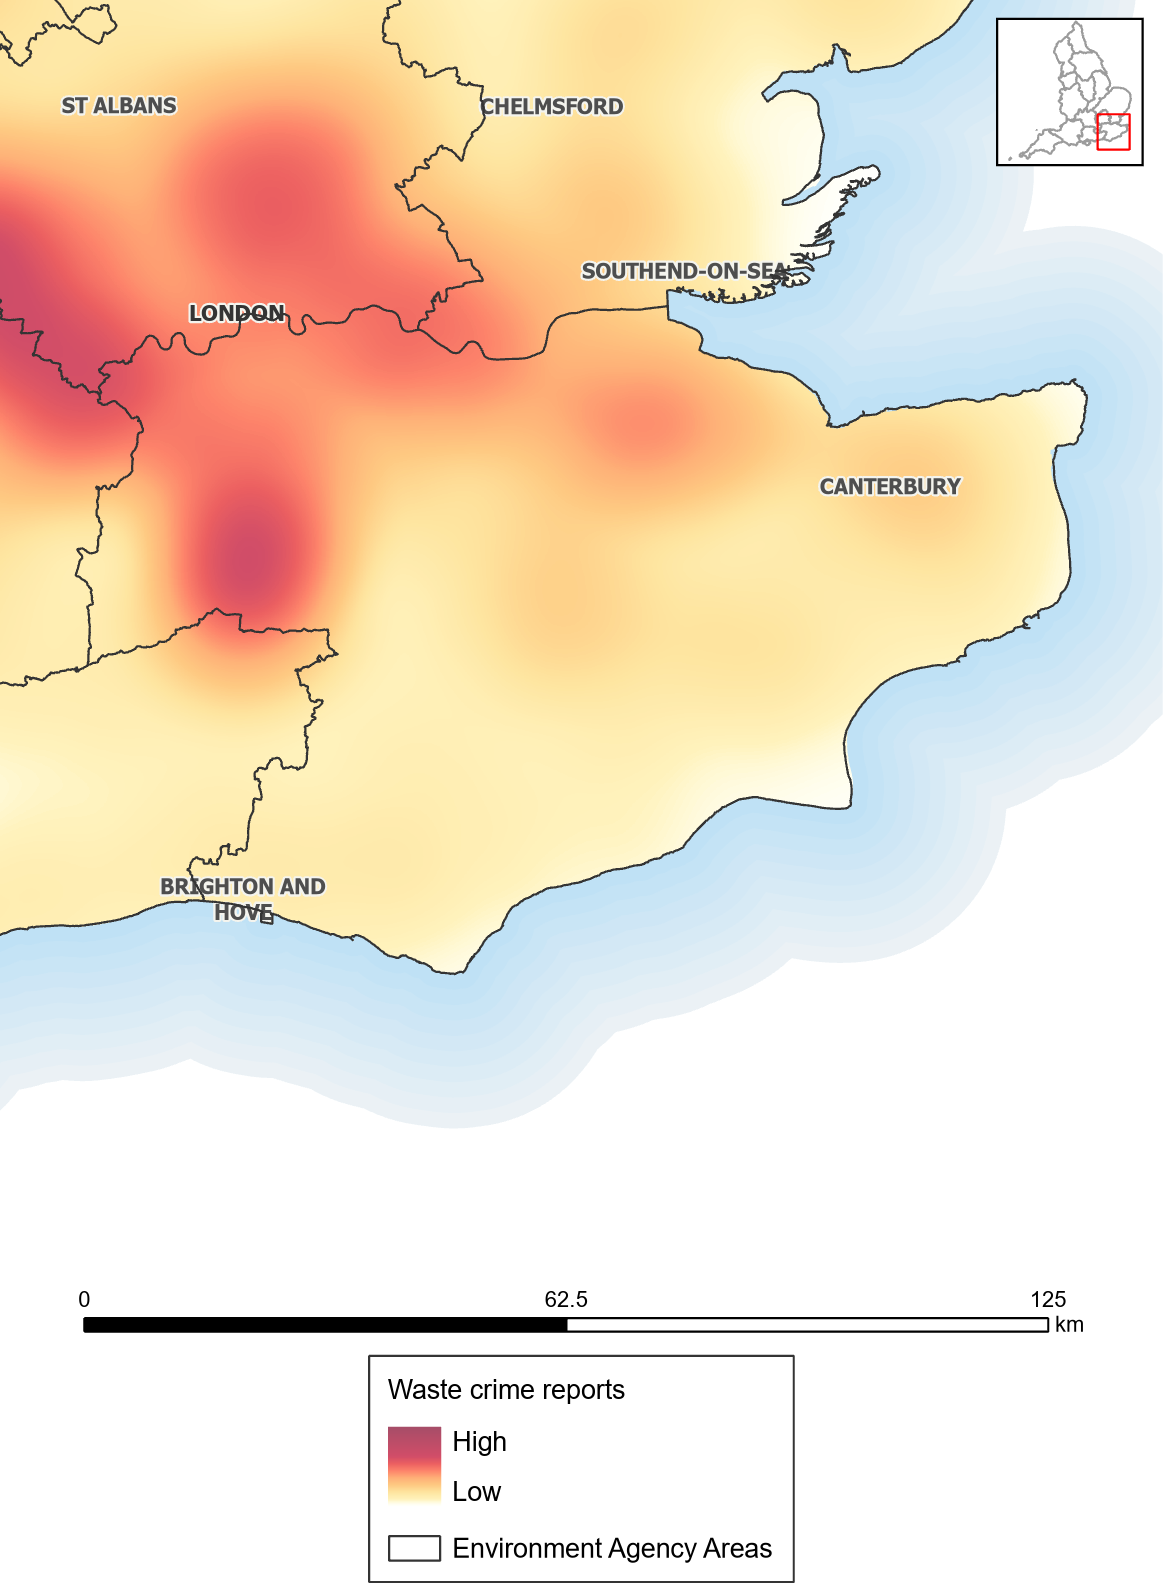
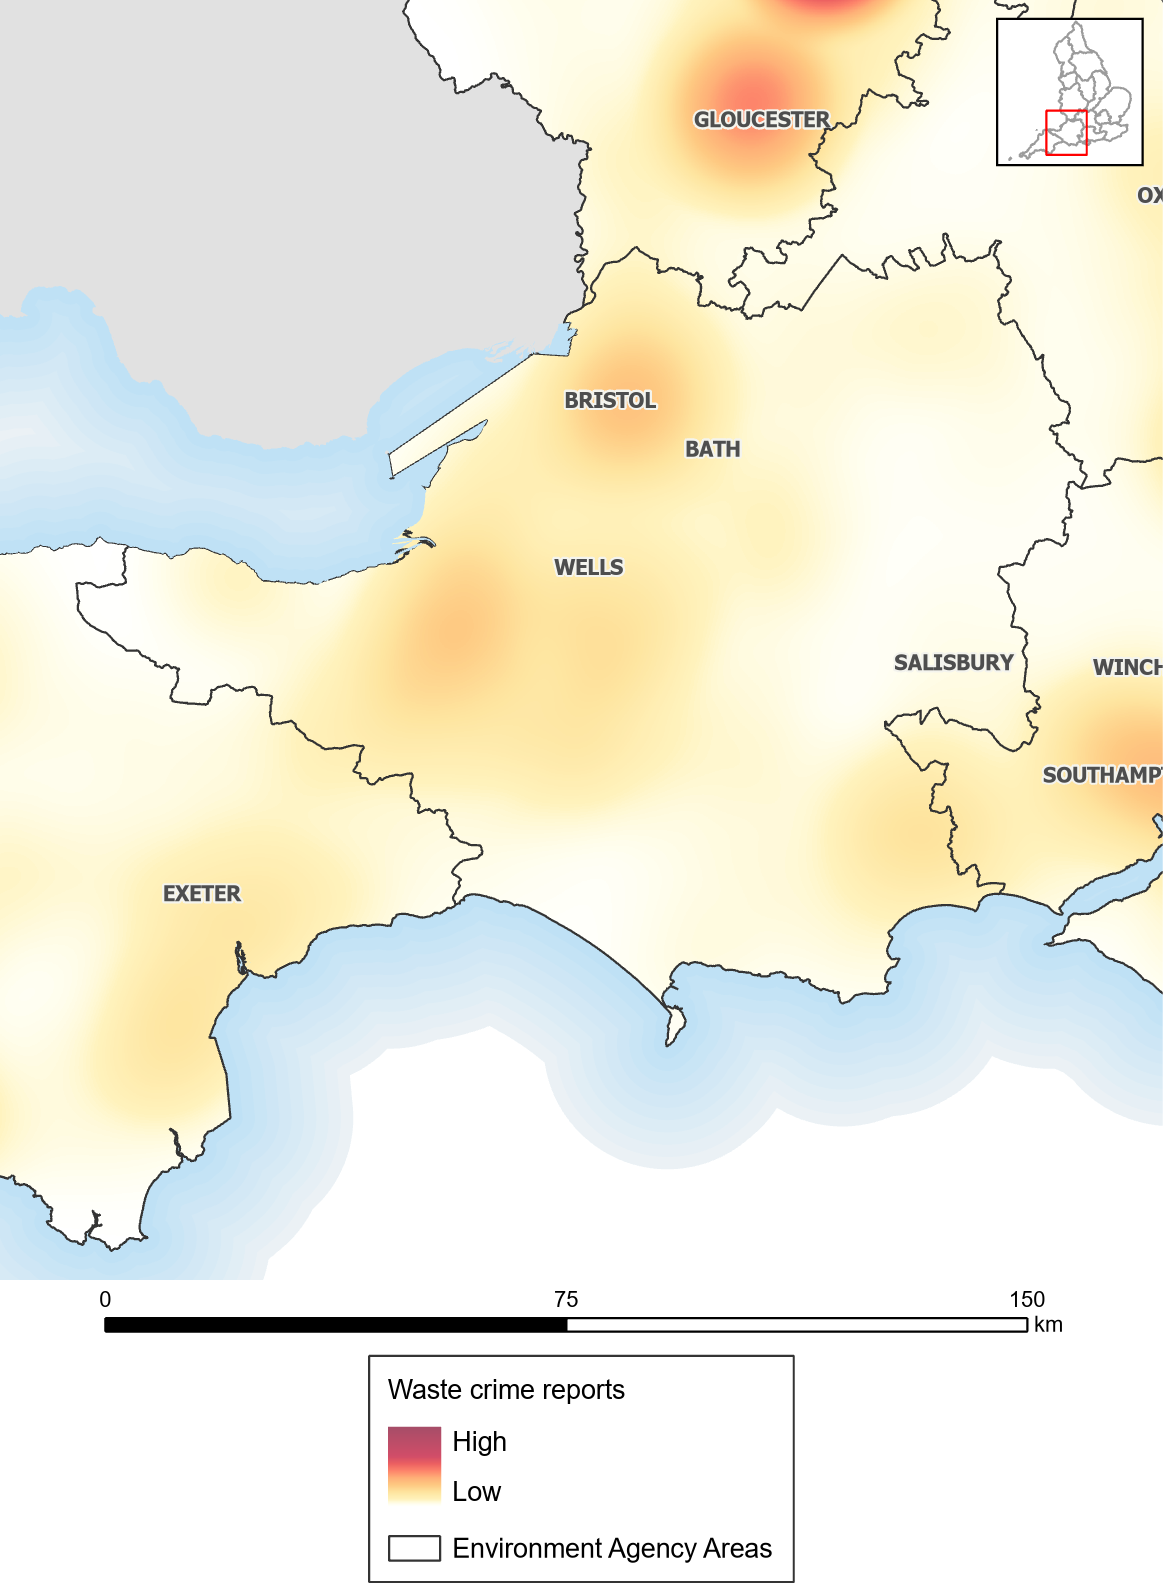
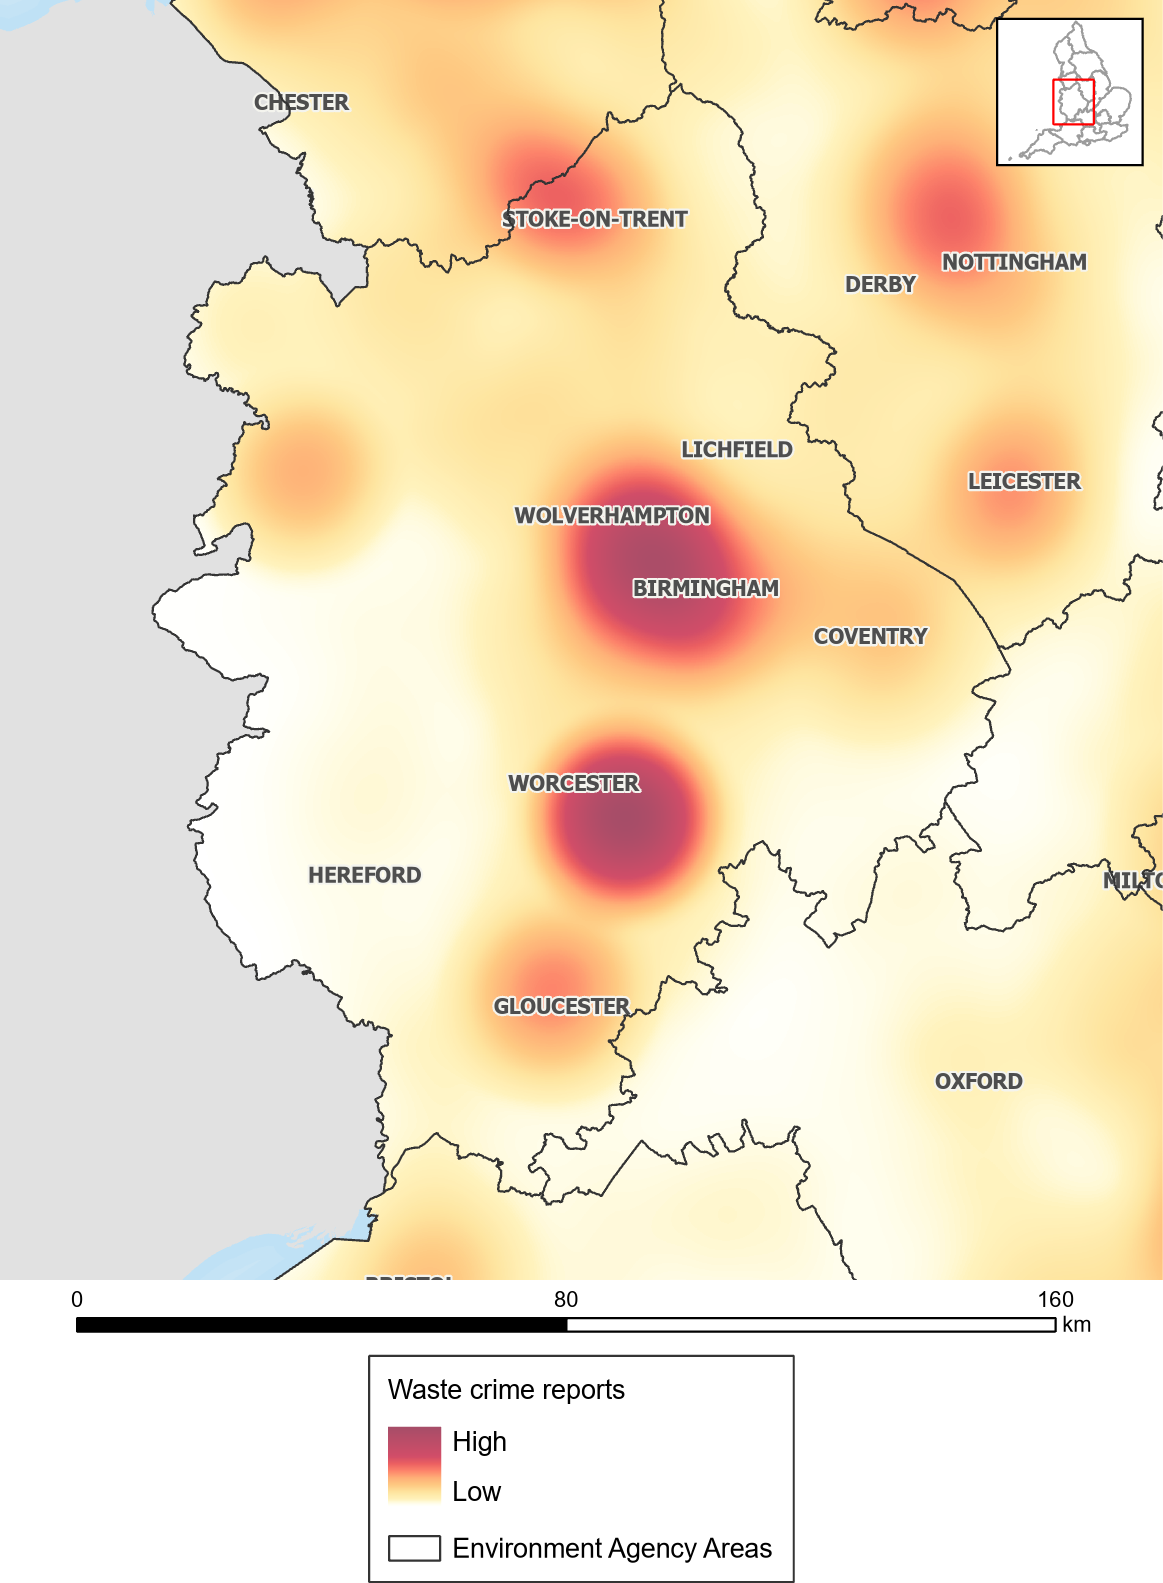
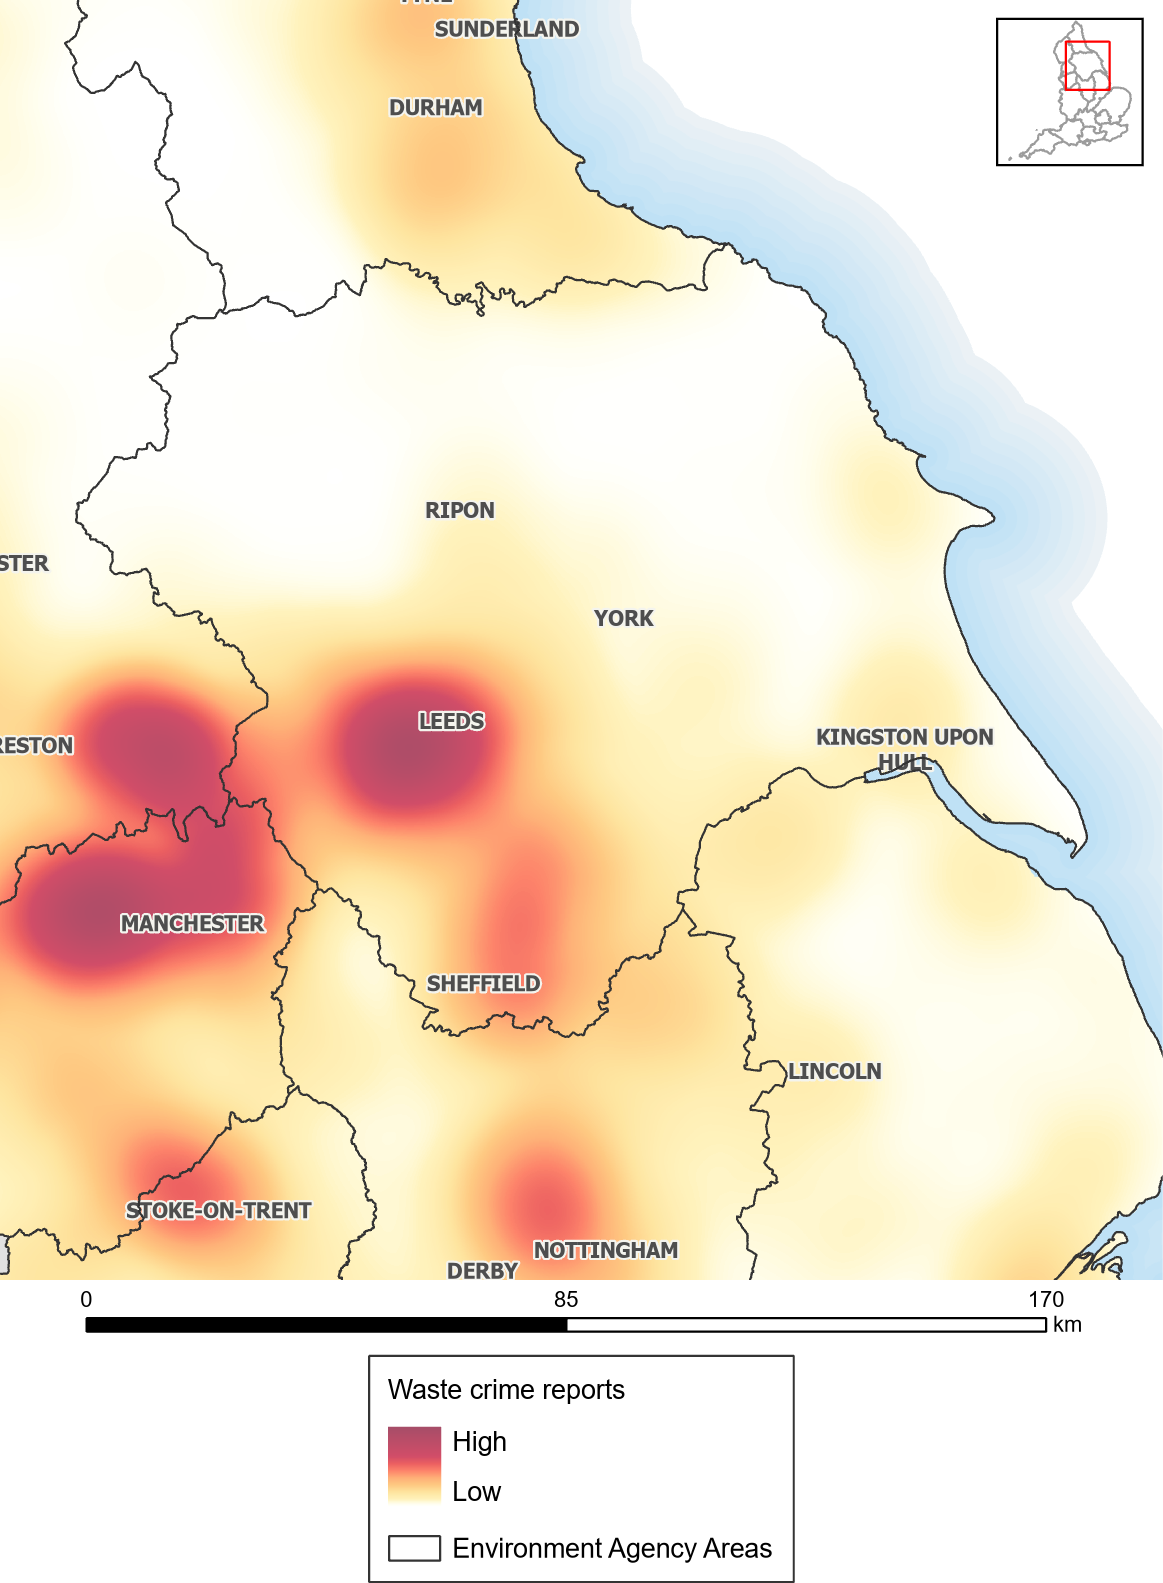
The Environment Agency also breaks the data down into its operational areas. The regional maps below show how concentrated reporting is within each area, with the Agency's own read of where the hot spots fall. The pattern is consistent: dense industrial and urban corridors in the north west, the Midlands and around London report the most, while rural areas such as the South West and North East sit lower on the scale.
How the map helps stop the crime
The value is operational. Enforcement resources are finite, so a map that ranks the country by reporting density lets the Agency send officers, and increasingly drones, to the areas most likely to yield a case, instead of spreading thin everywhere. It also builds the evidential picture over time: a cluster that reappears year on year, now that the map is in its second annual edition, justifies surveillance and supports the confiscation and prosecution powers now being strengthened, including maximum fines rising from £300 to £5,000. In Bradford, a site on Midland Road first flagged by a single member of the public in July 2026 moved from a dot on the map to a funded clean-up and investigation. The map turns scattered public sightings into targets, which is why the Agency's message is that every report counts.
What it means for you
There is a practical duty-of-care point behind the headlines. If you hand household or business waste to a carrier who is not registered and it is later fly-tipped, you can be held liable, so before hiring a skip or a collection, check the operator on the Environment Agency's public register of waste carriers, brokers and dealers. And because the whole system runs on public intelligence, reporting matters: suspicious activity can be reported anonymously to Crimestoppers on 0800 555 111 or to the Agency's 24-hour incident hotline on 0800 80 70 60. A single call is how a hidden site becomes a dark spot on next year's map, and then a prosecution.
Contains public sector information licensed under the Open Government Licence v3.0. Source: Environment Agency.
RELATED GUIDES
DISCLAIMER
This article is editorial information based on Environment Agency and GOV.UK sources, published for general understanding. Figures reflect the 2025 reporting year and may change; check the primary sources listed below and report suspected waste crime through the official channels before acting.
Frequently asked questions
What is a waste crime heat map
It is a density map of England shaded by how tightly public reports of suspected waste crime cluster, so concentrations stand out visually. It shows where crime is reported rather than a plain list of totals.
How does the Environment Agency make the heat map
It plots every call to its incident hotline in 2025 by the general area the caller was in, and aggregates those 10,238 reports into a density surface. The map reflects reporting, not confirmed crime.
Does a hotspot mean an area has the most waste crime
Not necessarily. A hotspot can reflect an engaged community that reports diligently, and with only about 27 per cent of waste crime reported, a quiet area on the map is not guaranteed to be clean.
Where are the worst waste crime hotspots
In 2025 the West Midlands (1,542) and Yorkshire (1,068) recorded the most reports, with dense clusters also around Manchester, Leeds, Birmingham and London.
How do I report waste crime
Report suspicious activity anonymously to Crimestoppers on 0800 555 111, or call the Environment Agency's 24-hour incident hotline on 0800 80 70 60. Also check any waste carrier is registered before you use them.
SOURCES
- GOV.UK / Environment Agency: waste crime reporting heat maps for 2025 - accessed 2 September 2026
- GOV.UK: waste crime heat maps reveal hotspots - accessed 2 September 2026


