Once a year, the Office for National Statistics publishes the closest thing Britain has to a factory-gate receipt: PRODCOM, the survey of UK manufacturers’ sales by product, itemised down to nearly 2,000 individual product lines - from marble slabs to military vessels, malt whisky to medicaments. It is the dataset that answers, precisely, a question usually argued in the abstract: what does Britain actually still make? We processed every product line in the 2025 release. The answer is a country whose industrial base is quietly becoming a food, aerospace and weapons economy, while the product that has defined its manufacturing for a century - the petrol car - falls away at historic speed. The headline: two years of decline, politely described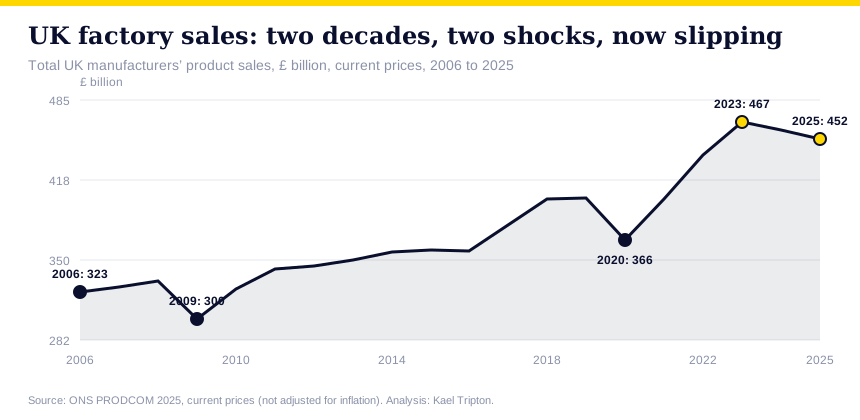 Total product sales came in at £452.0 billion for 2025, down 1.8% on 2024, which was itself down on the 2023 peak of £466.7 billion. Two consecutive annual falls is a sequence Britain’s factory data has previously produced only around the financial crisis and the pandemic - and this time there is no crisis to blame, just demand, energy costs and the long tail of the car transition. One caveat sharpens rather than softens the picture: these are current prices, not adjusted for inflation. In a period when factory-gate prices were still rising, a 1.8% nominal fall understates the real-terms shrinkage. The £452 billion of 2025 buys considerably less factory output than the same figure would have in 2023. The longer view is gentler but makes the same point. Since 2006, nominal sales are up 40% - roughly flat in real terms across two decades in which the economy as a whole grew substantially. Manufacturing did not collapse, as the popular story has it; it treaded water while everything around it grew, and its composition changed almost beyond recognition. That composition is where the 2025 data gets genuinely interesting. Food is the new industrial base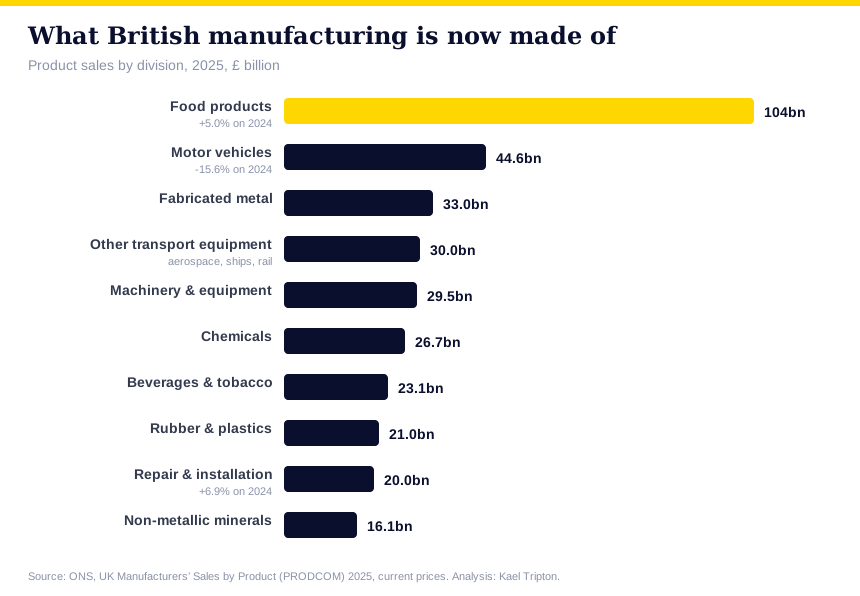 The largest manufacturing division in Britain is not cars, aerospace or pharmaceuticals. It is food, at £103.6 billion - up 5% in a difficult year, up 56.6% over the decade, and now more than twice the size of the motor industry. Add beverages and tobacco (£23.1 billion, carried by drinks) and roughly £127 billion - more than one pound in four of everything British factories sell - is something to eat or drink. The product lines beneath the division read like a national menu with a P&L attached: £7.3 billion of fresh beef and veal cuts (up 15% in a year, as meat prices surged), £6.6 billion of soft drinks (up 10.2%), £5.5 billion of beer, £4.8 billion of cakes and pastries, £4.6 billion of whisky (up 7.6% despite everything the export market has thrown at it), £4.0 billion of fresh poultry. The fastest-growing substantial product in the entire dataset is sausages and prepared meats, up 38.3% to £3.0 billion. Some of this is genuine volume; much of it is food-price inflation passing through factory gates - the same inflation households met at the supermarket shelf, here seen from the other side of the till. Either way, the direction of a decade is unambiguous: as Britain’s heavy industries shrank, its food industry took their place at the top of the table, largely unremarked. The car cliff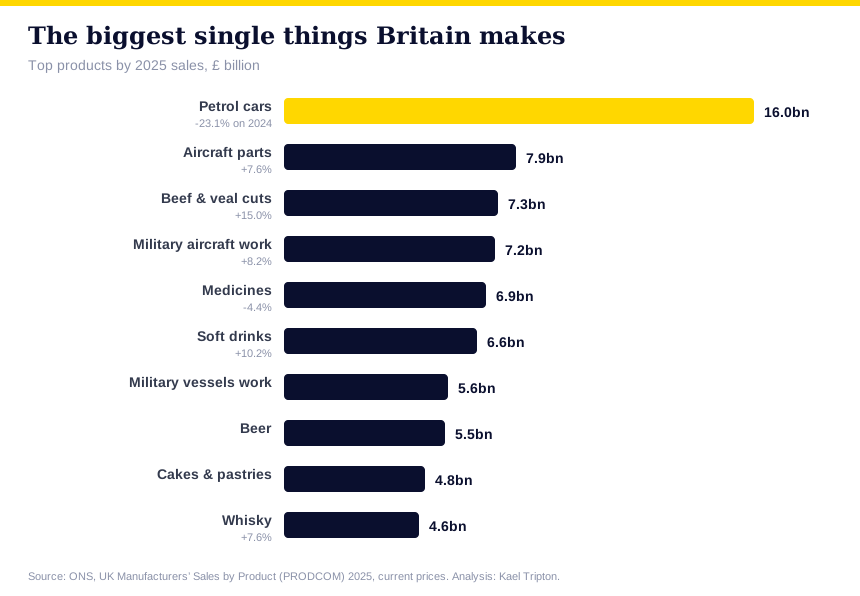 The single biggest product Britain makes remains the spark-ignition car - the ordinary petrol car - at £16.0 billion. It is also the dataset’s most dramatic casualty: down 23.1% in a single year, within a motor vehicles division down 15.6% to £44.6 billion, which now sits 7.9% below where it stood a decade ago in cash terms - the only major division to have shrunk nominally since 2015. The mechanics are visible from outside the data: model changeovers as plants retool for electric production, weak European demand, and the strategic wind-down of combustion volumes ahead of the zero-emission mandate. What the data adds is scale and speed - a quarter of the biggest product in British manufacturing, gone in twelve months - and a warning about the transition’s arithmetic: the electric models replacing those volumes are not yet doing so pound for pound in these tables. For the regions built around car plants, the gap between the petrol line falling and the electric line rising is measured in jobs, and the 2025 register catches that gap wide open. The rearmament economy arrives in the data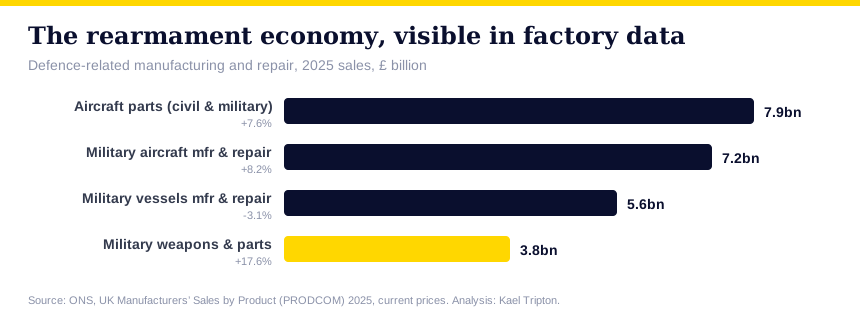 Four product lines tell the geopolitical story of the decade more crisply than any speech. Manufacture, installation and repair of military aircraft: £7.2 billion, up 8.2%. Aircraft parts, feeding both civil recovery and defence programmes: £7.9 billion, up 7.6%. Military vessels: £5.6 billion. And the sharpest line in the entire dataset - manufacture of military weapons and parts, up 17.6% in a year to £3.8 billion. Taken together, identifiable defence-related manufacturing and repair comfortably exceeds £24 billion, larger than the chemicals industry and closing on machinery - and unlike cars, every line of it is growing. The rearmament of Europe is usually discussed as a budget line; PRODCOM shows it as a production line, and one of the few reliably expanding parts of British industry. Winners, losers and one very British oddity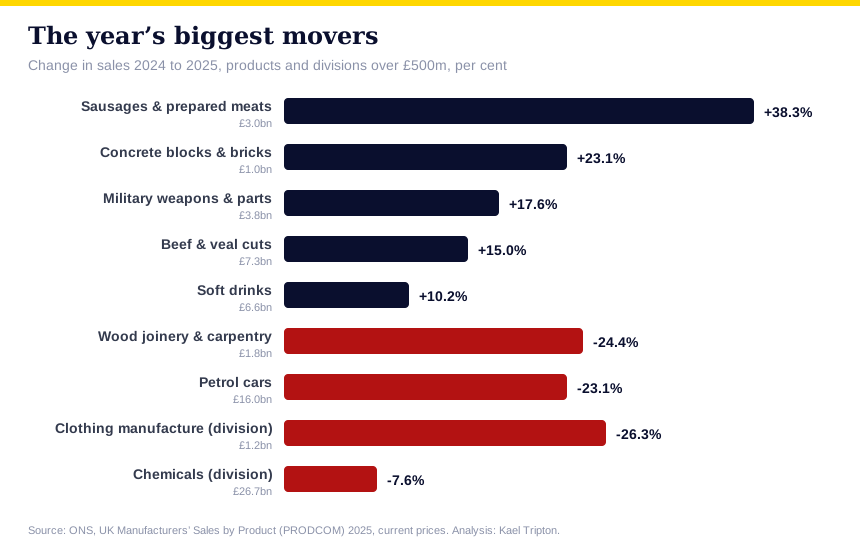 Beyond the headline sectors, the year’s movers sketch the economy’s pressure points with unusual precision. Up: concrete blocks and bricks, 23.1% to £1.0 billion - infrastructure and energy projects pouring foundations even as private construction stalled. Down: builders’ joinery and carpentry of wood, 24.4% to £1.8 billion - the doors, windows and staircases of the housebuilding slowdown, falling in near-perfect mirror image. The two lines together are the construction market’s split personality, state up and private down, rendered in building materials. And at the bottom of the table sits the quiet end of a very long story: clothing manufacture, down 26.3% in a single year to £1.2 billion - a division that once defined entire English and Scottish cities now smaller than the sausage line, with leather goods (down 11.6% to under £500 million) close behind. Britain still designs and sells clothes in vast quantity; it has now almost entirely stopped making them, and the 2025 data reads like the final pages of that particular book. The quiet star: fixing thingsOne division grew through both down years without attracting a single headline: repair and installation of machinery and equipment, up 6.9% in 2025 to £20.0 billion and up 40% over the decade. It is now within touching distance of the entire rubber and plastics industry, and its growth says something specific about the economy underneath: when new capital equipment is expensive and money is tight, factories maintain what they have. Maintenance is counter-cyclical manufacturing - it booms precisely when the rest of the table struggles - and it is labour-intensive, regionally spread, and impossible to offshore. If the question is where secure industrial employment is actually being created in Britain right now, the least glamorous line in the dataset is the best answer available: in the maintenance sheds, keeping twenty-year-old machinery alive for another shift. It is also a line to watch as an early indicator - a fall in repair spending historically precedes a rise in new equipment orders, and vice versa. What it means for your money
How we did this, and what to checkWe computed every figure from the ONS PRODCOM 2025 final workbook: 1,982 product lines with reported sales value, plus the division and industry summary tables, covering 2015 to 2025 with headline totals back to 2006. All values are current prices - nominal pounds, not adjusted for inflation - exactly as published, and percentage changes are calculated on those values. PRODCOM is a survey of manufacturers above size thresholds with results weighted to the business register; the ONS publishes standard errors, response rates and revisions in a companion quality workbook, and some product cells are suppressed as disclosive where too few firms report. Product descriptions are abbreviated in our charts for readability; codes and full definitions are in the source. The workbook is public - check our arithmetic. Analysis: Kael Tripton, from ONS, UK Manufacturers’ Sales by Product (PRODCOM) 2025, final results, current prices. General information, not investment advice. Updated annually when the next PRODCOM release publishes. Frequently asked questionsWhat is the biggest thing Britain manufactures?By single product, petrol cars: £16.0 billion of sales in 2025, despite a 23.1% fall in a year. By division, food products dominate at £103.6 billion - more than double the entire motor industry. Is UK manufacturing growing or shrinking?Shrinking, for a second consecutive year: total sales fell 1.8% in 2025 to £452 billion, from a £466.7 billion peak in 2023 - and those are nominal figures, so the real-terms fall is larger. How big is the UK defence manufacturing industry?Identifiable defence-related lines - military aircraft, vessels, weapons and associated parts - exceed £24 billion in the 2025 data, with military weapons production the fastest-growing substantial line in the dataset at +17.6%. Why did UK car manufacturing fall so much in 2025?Petrol car sales fell 23.1% as plants retooled for electric models, European demand weakened and combustion volumes wound down ahead of the zero-emission mandate - with electric output not yet replacing the lost value pound for pound. What is PRODCOM?The ONS annual survey of UK manufacturers’ sales by product - nearly 2,000 product lines with sales values and volumes, the most detailed public record of what British factories actually sell. Does Britain still make clothes?Barely. Clothing manufacture fell 26.3% in 2025 to £1.2 billion - smaller than the country’s sausage and prepared-meat production - continuing a decades-long move of garment making overseas. Read next |
What Britain Still Makes: The Factory Data, ChartedWe processed all 1,982 product lines in the official factory-sales data. Food is now Britain’s biggest manufacturing business, petrol cars crashed 23% in a year, and the fastest-growing line is military weapons. 
Illustrative image. AI-generated and does not depict real people, places or events.
Editorial Disclaimer The content on Kaeltripton.com is for informational and educational purposes only and does not constitute financial, investment, tax, legal or regulatory advice. Kaeltripton.com is not authorised or regulated by the Financial Conduct Authority (FCA) and is not a financial adviser, mortgage broker, insurance intermediary or investment firm. Nothing on this site should be construed as a personal recommendation. Rates, figures and product details are indicative only, subject to change without notice, and should always be verified directly with the relevant provider, HMRC, the FCA register, the Bank of England, Ofgem or other appropriate authority before any financial decision is made. Past performance is not a reliable indicator of future results. If you require regulated financial advice, please consult a qualified adviser authorised by the FCA. 
|


