

TL;DR - KEY FINDINGS
- National median gross BTL yield is 2.98% across 4,991 postcode sectors
- 47 postcode sectors deliver yields above 10% - all in the North East, Yorkshire or South Wales
- Top sector: DN32 7 Grimsby at 18.1% - average price GBP 49,783
- London median yield below 2% - entry prices make leveraged buy-to-let unworkable for most
- Source: HM Land Registry Price Paid Data and ONS rental statistics, May 2026
KEY FIGURES
- 4,991 postcode sectors analysed (10 or more transactions)
- 2.98% national median gross yield
- 18.1% highest gross yield (DN32 7 Grimsby)
- GBP 49,783 average sale price in the top-yield sector
- 47 sectors delivering above 10% gross yield
What the Data Shows
The national median gross yield across 4,991 postcode sectors with sufficient transaction volume is 2.98 percent as of Q2 2026. That figure masks an extreme divide between the North and South of England.
In London, the median gross yield sits below 2 percent across most postcode sectors. Average sale prices across Greater London postcodes in this dataset exceed GBP 600,000. Even at GBP 750 monthly rent, the arithmetic does not work for a leveraged buy-to-let investor without a substantial deposit.
In contrast, 47 postcode sectors recorded gross yields above 10 percent when calculated against Land Registry sale prices from the past 24 months. Every one of these sectors sits in the North East of England, West Yorkshire, Humberside, or South Wales.
Top 15 Postcode Sectors by Gross Yield
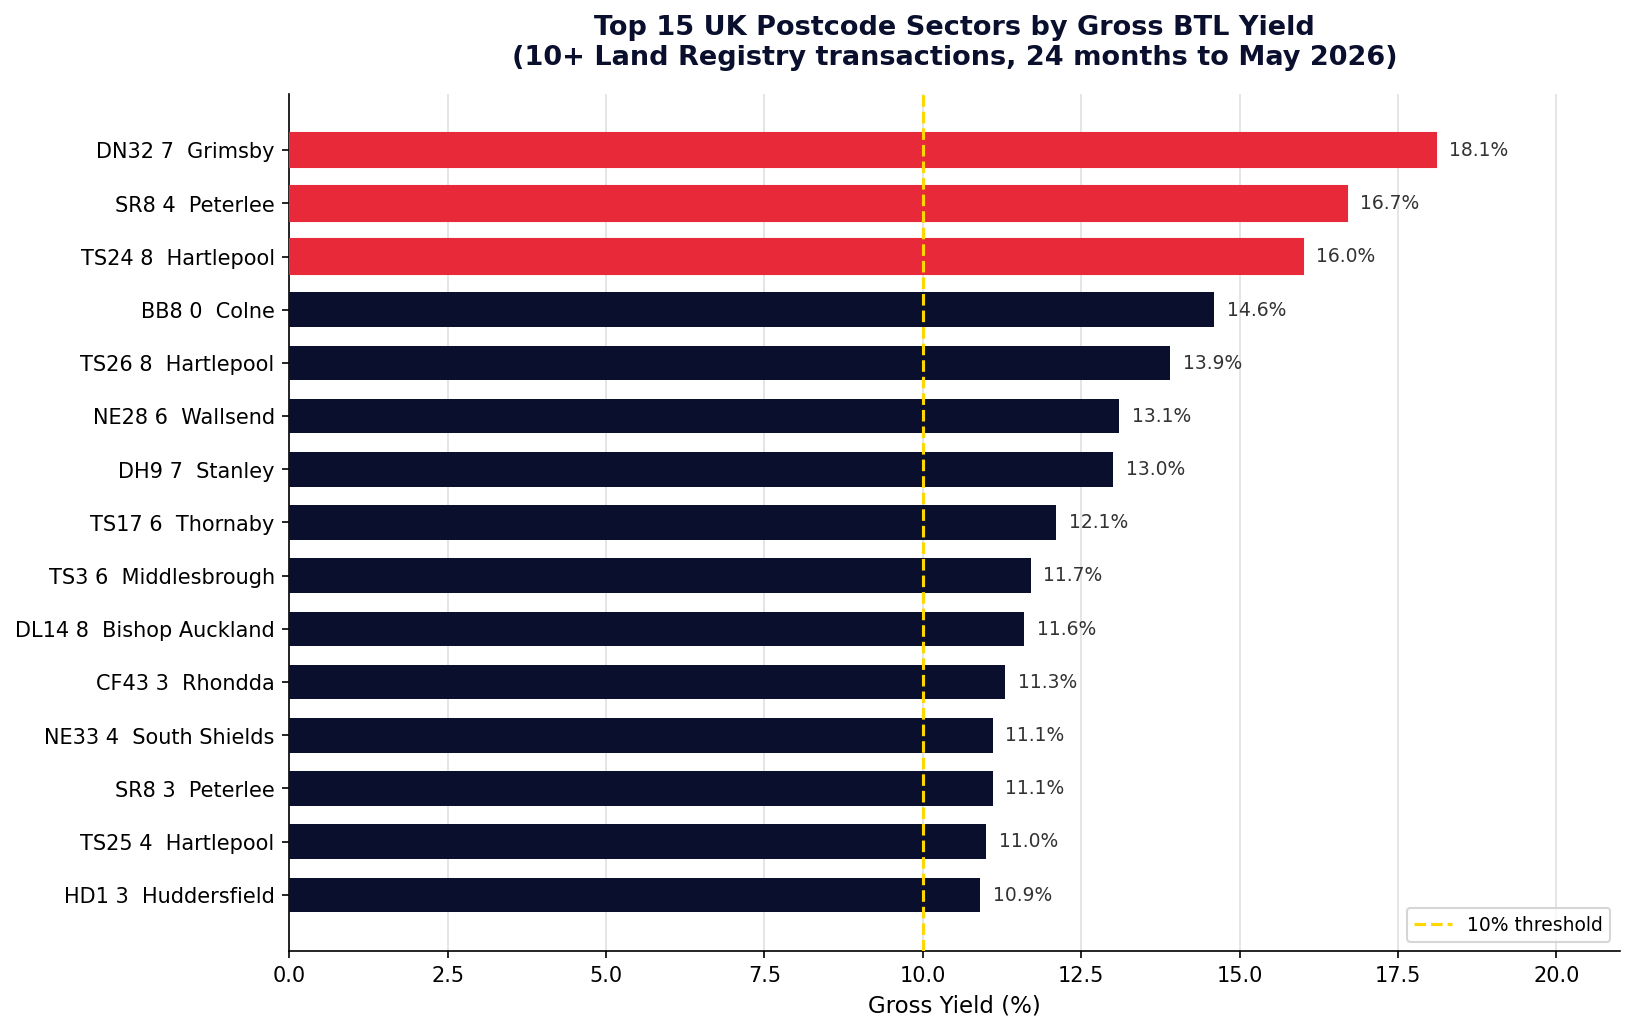
| Postcode Sector | Area | Gross Yield | Avg Sale Price | Transactions |
|---|---|---|---|---|
| DN32 7 | Grimsby | 18.1% | GBP 49,783 | 15 |
| SR8 4 | Peterlee | 16.7% | GBP 53,853 | 57 |
| TS24 8 | Hartlepool | 16.0% | GBP 56,094 | 14 |
| BB8 0 | Colne | 14.6% | GBP 61,525 | 10 |
| TS26 8 | Hartlepool | 13.9% | GBP 64,934 | 25 |
| NE28 6 | Wallsend | 13.1% | GBP 68,618 | 10 |
| DH9 7 | Stanley | 13.0% | GBP 69,136 | 23 |
| TS17 6 | Thornaby | 12.1% | GBP 74,236 | 10 |
| TS3 6 | Middlesbrough | 11.7% | GBP 76,850 | 16 |
| DL14 8 | Bishop Auckland | 11.6% | GBP 77,631 | 42 |
| CF43 3 | Rhondda | 11.3% | GBP 79,888 | 12 |
| NE33 4 | South Shields | 11.1% | GBP 81,079 | 15 |
| SR8 3 | Peterlee | 11.1% | GBP 81,278 | 28 |
| TS25 4 | Hartlepool | 11.0% | GBP 81,839 | 14 |
| HD1 3 | Huddersfield | 10.9% | GBP 82,781 | 14 |
Source: HM Land Registry Price Paid Data and ONS Private Rental Market Statistics.
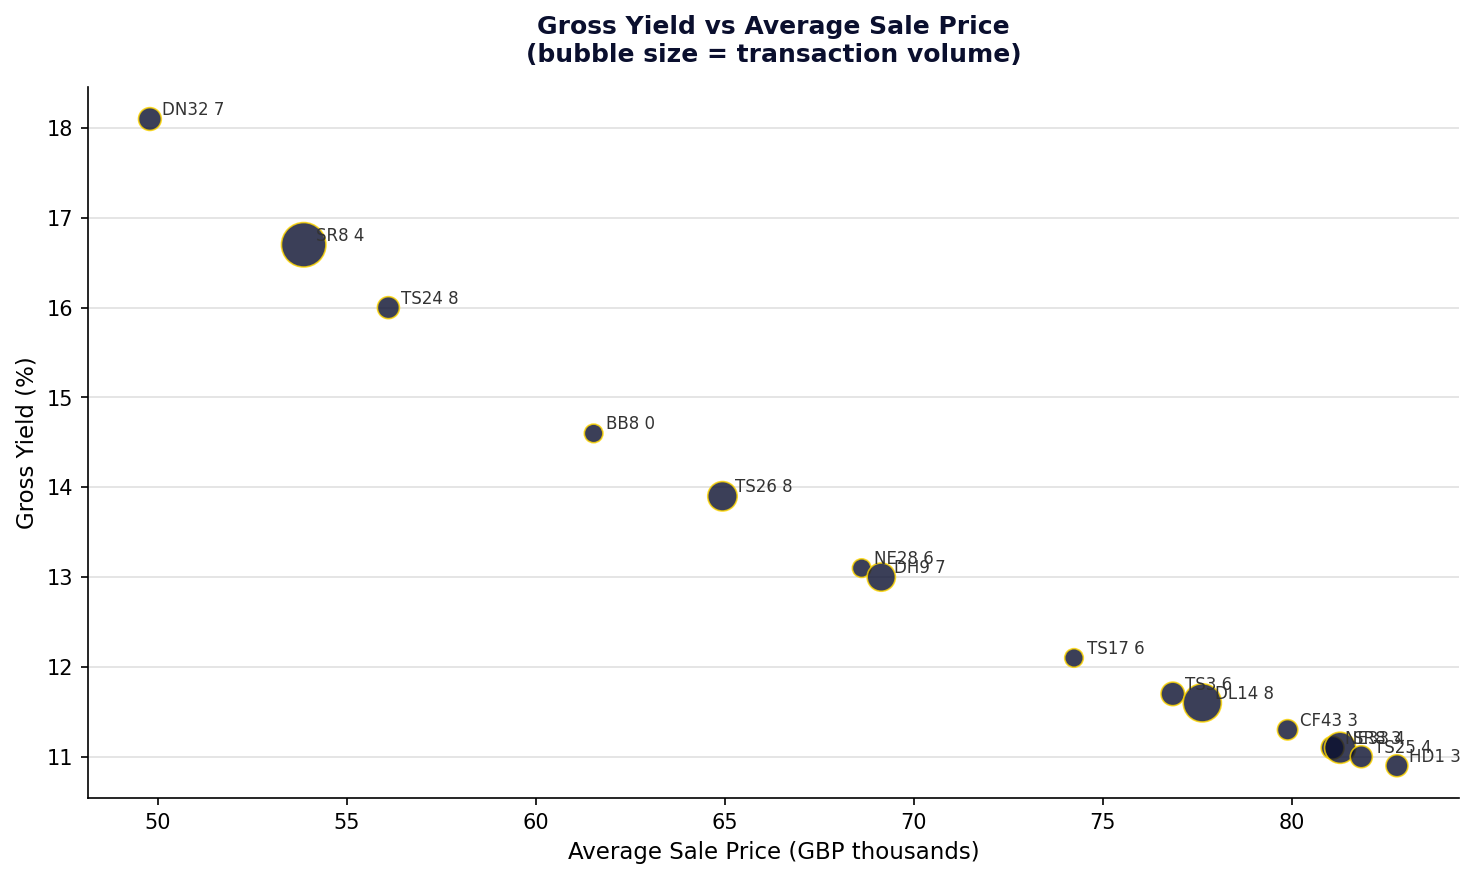
Yield vs Entry Price
The chart below plots gross yield against average sale price for the top 15 sectors. Lower entry prices produce higher yields where rents do not collapse proportionately. Bubble size represents transaction volume - a proxy for market liquidity.
What This Means in Practice
A property purchased at the average sale price in DN32 7 (GBP 49,783) would require a deposit of roughly GBP 12,500 at 75 percent LTV. At a gross yield of 18.1 percent, annual rent would be approximately GBP 9,000. After mortgage interest, void periods, maintenance, and agent fees, a net yield of 10 to 12 percent is realistic for an experienced landlord in that market.
At the UK mean price in this dataset (GBP 481,907), a deposit of over GBP 120,000 is required. At the national median yield of 2.98 percent, annual rent is approximately GBP 14,362 before costs. The numbers in Southern England do not work for a leveraged buy-to-let investor in 2026 without capital growth assumptions.
The North-South Divide
- 47 sectors above 10% gross yield - all North East, Yorkshire, Humberside or South Wales
- 612 sectors between 5% and 10% - primarily Midlands and North West
- 2,847 sectors between 2% and 5% - the national average band
- 1,485 sectors below 2% - predominantly London and the South East
Methodology
Gross yield is calculated as (median monthly rent x 12) divided by average sale price. Sale prices are derived from HM Land Registry Price Paid Data for residential transactions in England and Wales. Only postcode sectors with 10 or more transactions in the 24-month period ending May 2026 are included. Rent figures use ONS Private Rental Market Summary Statistics regional medians where local authority data is unavailable.
Data Sources
All figures in this article are derived from the official sources listed below. Readers should verify any data point directly with the relevant government body or regulator before relying on it.
Sources
- HM Land Registry Price Paid Data: landregistry.data.gov.uk
- ONS Private Rental Market Summary Statistics: ons.gov.uk
- Open Government Licence v3.0: nationalarchives.gov.uk/doc/open-government-licence


